Tuesday, May 30, 2017

Year of DC fast charging and battery degradation estimate

After about 1 year of SparkEV ownership, I started to log DCFC data for about a year, which resulted in 104 data points, average of exactly 2 DCFC per week. Coincidence or fake, you be the judge. I mostly use ABB chargers, which show percent, energy in kWh, and time.

Recorded from ABB charger:

starting battery in %
ending battery in %
total energy in kWh
elapsed time

Car shows miles. Recorded from car:

starting miles
ending miles

I started with recording the date and time and ambient temperature, but I got lazy and those records are spotty (only for the first one). But above data have been recorded on almost every DCFC session.

Look of raw data

What do you do with so much data? Why you generate figures, of course. We are visual creatures, and we love curvy figures. This is why strip clubs are profitable; we go there to stare at curvy figures! As with strippers, we’d rather look at real data, not fake ones (or pretend fakes are real). One way to do that is to look at the data from a known source. In this case, energy in kWh and charge time in minutes are strictly from the charger, and independent of the car. That’s what I plot first.
All those years of strip club training to spot fakes paid off as I can spot bimodal distribution right away in this graph. You can see that there are two (or more) distinct curves taking shape. This sets the tone for this blog post: major judgment call is based on strip club training. Therefore, this blog post should be treated as such.

All data and analysis are completely subjective, probably wrong, and should not be trusted!

I will give the raw data and source code to analysis, so you can judge for yourself how valid these may be. I find some strippers very pretty, so you may find the data and analysis presented here just as pretty.

Spotting fake

To get a better understanding, I infer average charge power (energy per unit time, aka division) over samples to see if there’s been any variations over time.
Indeed, you can see a sharp increase in average power at about sample 35. What happened? I did not change my charging locations or driving pattern, so it’s probably not the car or me. But ABB chargers used to update the data every second, and they changed to update every 10 seconds some time in the past. I speculate that change in ABB chargers occurred at about sample #35.

Then I go back to plotting charger-only data of energy vs time for samples 1 to 34 and 35 to end.
Plots are lot better, though samples 35 to end looks like there’s yet another pattern. It could be that some DCFC units are not up to snuff as others?

But a bigger question is, which data is closer to real, samples 1 to 34 or 35 to end? Apparently, I need more strip club training to spot the fake! Or in this case, I turn to even more powerful tool: guessing.

I have another piece of data to help determine which may be real, which is the efficiency reported by the car. Over the course of over 19K miles, SparkEV shows 5.3 mi/kWh. 16K miles shown, but it hasn't changed.
Since we have miles estimate for each DCFC session (ending miles minus starting miles, both reported by the car), and we have energy (kWh reported by the charger), we simply divide the values to get mi/kWh estimate for each charge session (or previous drive session since miles are determined based on past driving cycle). It’s combining two uncalibrated sources, but what the heck, it’s close enough for free blog post!
You can clearly see that samples 1 to 34 are much higher than later samples. Which is fake?

Here, we look at the average for each. For samples 1 to 34, average is about 5.75 mi/kWh (cyan line) while the rest are about 4.9 mi/kWh (magenta line). But remember, DCFC is not 100% efficient. From previous blog post about SparkEV being the most efficient car in world history, we estimate about 94% efficiency for DCFC.

http://sparkev.blogspot.com/2017/02/sparkev-is-most-efficient-car-in-world.html

Then we plot 5.3 mi/kWh (green line) and 94% of that (~5 mi/kWh, red line). It seems first set of data to sample 34 is fake. It’s a not a problem; with advances in science, Dr. SparkEV will simply perform a surgery to make it come into shape as the real data so that power vs samples look pretty. There’s no fake data here!
As with plastic surgery, making the data look good is subjective. One might think that since we know the average of both sets of data (samples 1 to 34 and 35 to end), simple scaling based on averages may work. Indeed, that’s what I did initially, but that still looked off. Best evenness is obtained by much trial and error, and that is shown in graph above. We will use this new “surgeried” data for further analysis.

Curvy figures with angular jags

There are many things one can infer from the data. First is various raw data over charge time, and some linear fitting.
From the raw data, you can see that greater than 20 minutes of charging time result in lower percent and energy than a straight line fit. This is expected since SparkEV would taper charge after 80%, and 20 minutes would get you above 80%.

The curve fitting is performed on data that had ending percent less than 85%, not on the entire data. Why not 80%? We’ll go over that in next section. But for now, you can see the linear fit shows 20 minutes of charging would give about 4% per minute (80% in 20 minutes), 3.76 miles per minute (75 miles in 20 minutes), 0.74 kWh per minute (14.8 kWh from charger in 20 minutes). Compared to L2 charging of  0.05 kWh from charger per minute (3.3 kW charger), DCFC is almost 15 times faster!

Charge taper

To get a better picture of charge taper, I plot average power (energy in kWh divided by charge time in hours) vs % charged. When the battery is above 80%, I would expect the power to dip, because that’s what I see at the charger if I’m staring at it.
As you can see, there aren’t too many charge sessions that ended below 80% (blue dots). This is one reason why 85% was chosen as the demarcation point for fitting the raw data in previous plot: not enough points below 80%.

In addition, I only recorded the total power after charging is done. That means all the readings are average of the entire charge session, not just to 80%. For example, had I started at 1% and charged to 90%, average power would be very high (45 kW?). But if I started at 80% and charged to 90%, average power would be much lower (25 kW?). 

And the most relevant reason is that 85% gave pretty good looking fit. I could’ve used 86% of 84%, but they just didn’t look as good. There’s no fake data, just pretty data!

For total charge percent (red dots), the taper starts roughly about 70%. That means I typically started charging at over 10% battery and stopped when charge taper became significant beyond 80% state of charge.

For ending charge percent (blue dots), it shows bit over 80% begins to taper. Most charge sessions end above 80%, but less than 90%. What this shows is that I charge near full power most times, not plug in when I already have 80% battery and make others wait while the car has severely tapered, unlike some (many) Nissan Leaf drivers plugged in when they already have 90%.

For few weeks (maybe few months), I was experimenting to see if I can only use DCFC without home charging as if I’m living in an apartment without the ability to charge at home or work. I did not want to inconvenience others, so I disconnected as soon as I saw another EV pull up. This is why there are several charge cycles less than 50% change (red dots), and  most of those are above 42 kW on average, full power without taper. In other words, no one waited for me needlessly, and I went out of my way to be polite to other EV.

Overstuffing battery capacity

A question I had is if one sees reduced battery capacity as it’s charged fuller. For example, higher percent could use more cell balancing or more intensive battery management, thus slowing down the percentage as kWh from the charger increase.
It’s not clear if there’s any kind of correlation. Certainly, temperature may have something to do with it as well as how long ago the cells were balanced. Unfortunately, I do not have access to battery temperature, so I never recorded the data. I call this inconclusive, though leaning towards higher charging (at least not to 100%) has no effect in capacity.

However, there seem to be some erroneous data. Some show battery capacity more than 20 kWh, and one shows almost 15 kWh. Obviously, those are bad data. My suspicion is that I was looking at some pretty girl nearby, and recorded the wrong data!

I count about 6 data points too high and one data point too low, so they will be discarded.

Energy for percent

Now that I know what data to discard, I can plot other data, which is charger energy (provided by charger) vs percent charged (provided by the car). If charge taper did not expend extra energy, it should be a straight line.
Here, we can infer some interesting data. First, it fits in a straight line, even the 90% charge, so charging more would not waste energy. At 100%, battery would be 17.6 kWh (red line fitting at 100%), which is 18.7 kWh from the charger. This is not 18.4 kWh, supposed battery capacity of SparkEV! What happened?

Remember, I started logging the data after one year to second year, so this represents average battery capacity for day 365 to day 730 of car ownership. As such, it should be less than the peak advertised battery capacity.

Battery capacity degradation

Now comes the biggie: battery capacity over time. We know the average battery capacity for the year that I recorded the data, but how did it degrade? Unfortunately, I did not log the day/time, so I can only guess even distribution of charge events. Then we plot this for each data set. Remember, sample 0 (shown as sample 1 in plot, damn you Matlab!) is one year after I started driving SparkEV.
Note the same high and low samples discarded based on previous findings.

The curve fit is done using linear fit and exponential fit, and they look like they are on top of each other. Even if the degradation is exponential decay, such small number of samples would make it seem indistinguishable from linear. I suspect the actual degradation is exponential rather than linear, like much of natural processes. But linear is lot easier to interpret for us simple minds. We will discuss long term fitting later.

The graph shows that the battery was 18.1 kWh at beginning of the recording (1 year of degradation), and degrading about 0.007 kWh each sample (about half week). At the end of recording (2 years of degradation), battery has 17.3 kWh remaining. Average is about 17.7 kWh, which is close 100% capacity found in previous graph.

I took a more accurate reading of battery capacity about 2 months after recording started, and that showed 18.05 kWh. More recent reading showed 17.3 kWh, so it seems the battery is degrading according to the estimate. I will discuss battery capacity in more detail in some future blog post.

Of course, we’re looking at a tiny sliver of time, the reason why exponential decay and linear are practically the same.

Battery capacity degradation extrapolated

Now that we can see how well the data fits over samples, we can extrapolate for many years. Recall that the data collection started a year after getting the car and 104 samples (about 2 samples per week) over a year, and only estimated to be evenly spaced two DCFC charging per week. But that’s close enough to real usage for this blog post (you didn't pay for it, did you?), and we extrapolate for many years using the same battery degradation equation from before.
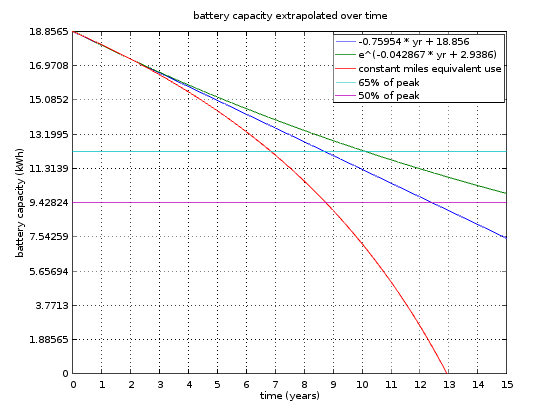
The years on x-axis are true years starting when the car was new. I extrapolated the data collected between year 1 to year 2 both ways, before data collection began (beginning of year 1 to year 0) and after last data collected (end of year 2 to end). It seems my car had 18.87 kWh available in the beginning (or did it?)

One thing clear is that curves (green, blue, red) diverge significantly after about year 5. That means you won’t be able to tell which path the battery degradation is following until then. But even then, noisy data will make it hard to tell maybe until 5% divergence; raw data is fluctuating about 1kWh total, so 0.5 kWh deviations would be apparent. Between blue and green, that occurs about year 8, the end of the warranty period. Between blue and red, that occurs about year 5.

Linear decay (blue) assumes same number of charging per given time interval for all time, 104 DCFC per year plus X number of home charging. But if I’m to keep driving same number of miles per year, there will be more charging. Simply, each charge cycle would be capable of fewer miles due to degraded battery, and more charging is needed to drive the same number of miles.

More charging per mile means more degraded battery. I plot this scenario as red plot. I made two known points to intersect: beginning of year 0 and ending of year 2. I suppose I could've made the intersection to be beginning of year 1 (first data collected) to end of year 2 (last data collected), but I chose year 0 and year 2 since they would generate worse degradation plot. Seeing how they are really close before about year 5 anyway, it probably won't make much difference either way.

The y-axis is divided into 10, so each represents 10%. To make it even easier to read, cyan line is 65%, and magenta line is 50%.

Life of a car

MrDRMorgan from SparkEV forum found that SparkEV battery warranty is to 65% in 8 years and 100K miles. If one follows linear trend (same number of charging per year, fewer miles driven each year), 65% would be reached well after eighth year.

If one has fewer charging events as time goes (much fewer miles), and follow the exponential decay curve (green plot), it could take bit over 10 years before hitting 65%. Unfortunately, this isn’t likely for most people, though some may get tired of frequent charging that they drive fewer miles with increasing degradation.

BUT if one drives the same number of miles by increasing the number of charging events, it could hit 65% in seventh year. That could trigger the warranty service. It’s unknown what Chevy will do if that happens: they may not replace the battery with a new one, but one that is barely above 65% that will take it to eighth year. In any case, this is an unpleasant scenario to avoid.

One might think that this is awful, but it may not be so bad. Biggest reason is that I have no idea what is the major contributor to capacity degradation. It may not be solely due to charge-discharge cycles that the red plot is based on. For most (all?) LiIon batteries, just letting it sit there would also cause degradation. If the major cause of degradation is time, then the degradation would follow blue curve (probably bit more since there'd be more charge-discharge cycles).

How do you tell if the major contributor to degradation is time or charge-discharge cycles? If there are same model year cars with much different number of miles (more or less charge cycles) and in similar climate and "abuse" that show similar degradation, that would indicate more of time dependence. Unfortunately, detailed battery capacity is hard to come by, not to mention finding other SparkEV with same usage pattern as mine.

Even if the battery has degraded beyond 35% (65% remain), car would still be usable. How much is it usable depends on how far the DCFC stations are spaced. Currently in SoCal, DCFC between San Diego to Orange County is about 30 miles apart, which means car must be capable of 40 miles (10 miles as margin). That’s about 50% capacity, although slow driving (55 MPH) could make it 40%.

Assuming no warranty service and looking at 50%, that occurs at about year 9 if driven same number of miles as current (red plot), year 12.5 if keeping the same number of charge events (linear, blue plot), and greater than year 15 if charging is reduced (fewer miles per year, green plot).

From my first blog post, I estimated the car to last 10 years in amortizing purchase price / lease price.

http://sparkev.blogspot.com/2015/05/first-of-all.html

It seems it can barely reach 10 years with careful driving.

But remember what I wrote earlier in this blog post:

All data and analysis are completely subjective, probably wrong, and should not be trusted!

Motivation

You might be wondering what prompted me to keep such meticulous data keeping after 1 year of use. I can assure you, it wasn’t because I wanted to put up with even more hassle of writing down charge data.

I use eVgo almost exclusively for DCFC. They give no receipt, and they didn’t even give a record of charging when I started using them in mid 2015. Couple of months later, they started sending emails of history of my usage, which they do about once a month. Fair enough.

Then about 1.5 year ago, I started receiving two emails that showed two different billing. There were much overlap in session records, and they replied to my inquiry that they were charging my credit card correctly. The rep replied that they would fix it, but it went on for many more months.

And then they charged me $5 out of the blue in addition to my monthly fee (including double billing)! I again inquired about the charge, to which the rep replied it was for something or another. I again asked them that there must be some error since I’m on $15/mo OTG plan and there’s no record of this $5 usage, but I never heard back from the rep.

I’m not happy about the poor customer service, but I didn’t bother pursuing the matter further as that could result in even more problems with billing or even bigger $$ charged to my account. Evgo is about the only DCFC available in my area, and losing that service via billing problem would mean unable to drive the car except to supermarkets. When you live in a glass house (or drive in glass charging infrastructure), it’s best not to throw stones.

From that point on, I decided to keep a record of DCFC sessions. Even if I can’t do anything about getting my money back, at least I’d know how much I’m getting ripped off. But keeping record has side benefits, which resulted in this wonderful blog post. Things don’t happen for a reason, but one can always turn a lemon into lemonade.

Appendix

As before, analysis is done using Octave. Copy-paste the code below to a text file and run it with Octave or Matlab. I keep it simple, and made it somewhat modular so I can reuse this with my next EV. Side benefit to that is that it can easily be used with other EV, too. As usual, sparse commenting.

close all; clear;

%raw data
pct_start   = [13 26 52 30 22 34 32 12 21 29 10 5 12 27 15 45 31 8 10 20 20 52 16 54 11 5 13 23 16 45 16 26 23 6 19 9 40 21 13 10 15 25 16 14 40 11 11 66 14 18 55 17 32 23 27 27 37 16 12 52 25 35 17 34 11 23 16 7 29 14 40 39 32 20 10 16 28 36 31 34 13 16 20 11 22 16 15 18 10 16 56 14 27 33 48 23 10 34 21 13 18 13 16 51];
miles_start = [12 28 50 33 24 31 32 14 23 29 12 5 12 27 16 42 31 8 11 19 19 52 17 52 12 6 13 24 17 45 16 23 24 7 19 19 37 20 13 10 16 25 16 14 39 10 10 65 13 19 53 16 32 20 27 26 39 16 13 47 24 34 19 32 10 22 17 7 29 15 42 32 32 19 9 16 28 36 31 32 13 16 18 11 20 12 15 16 10 17 51 14 27 31 51 22 9 38 20 11 14 13 17 49];
pct_end     = [85 82 87 85 70 86 84 83 61 85 86 85 93 89 68 85 84 83 87 83 64 84 69 83 87 90 83 81 81 85 94 92 94 94 84 85 77 93 89 85 83 84 83 83 81 90 80 82 83 80 83 89 84 86 83 83 79 85 76 84 83 85 83 86 85 77 75 95 82 50 85 80 81 82 81 88 89 81 87 85 85 82 84 90 86 89 84 80 81 78 83 81 82 82 84 88 83 80 81 85 85 85 85 83];
charge_kwh  = [12.09 9.54 6.02 8.75 8.2 8.74 8.85 12.18 6.73 9.5 12.6 13.24 13.57 10.53 8.82 6.81 8.87 12.76 13.1 10.86 7.46 5.45 8.82 4.74 14.25 16.15 11.53 9.63 10.9 6.74 13.12 11.13 13.49 16.33 12.24 12.21 6.83 13.53 14.91 14.36 13 11.37 13 13.12 7.79 15.12 13.11 3.25 13.03 11.6 5.4 14 9.85 12 10.13 10.88 7.79 12.87 11.56 6 10.75 9.12 12.17 9.65 13.58 10.07 10.78 16.35 10.03 6.73 8.43 7.5 9.26 11.5 13.03 13.35 11.46 8.43 10.4 9.79 13.45 12.19 12.22 14.56 11.88 13.25 13 11.62 13.03 11.6 5.37 12.28 10.2 9.33 6.78 11.98 13.82 8.57 10.8 12.98 12.24 13 12.91 6.12];
time_min    = [18 14 9 13 12 13 13 18 10 14 19 20 22 16 13 10 13 19 20 16 11 8 13 7 19 22 17 14 16 10 22 18 20 24 16 16 11 19 20 19 17 15 17 17 10 21 17 4 17 15 7 19 13 16 14 14 10 17 15 8 14 12 16 13 22 13 14 25 13 9 11 12 12 15 17 18 16 11 14 13 18 16 16 20 16 18 17 15 17 15 7 16 13 12 9 16 18 11 14 17 16 17 17 8];
miles_end   = [83 82 86 81 68 81 80 90 65 86 87 85 91 86 66 79 83 82 89 82 64 83 66 80 86 95 82 79 79 84 92 87 88 91 81 83 72 87 85 84 83 82 82 81 78 84 74 77 77 77 78 83 80 79 80 77 74 78 70 76 76 76 82 84 77 71 70 88 76 50 85 73 74 71 71 79 83 76 81 79 78 74 75 83 77 76 73 70 70 71 76 76 77 80 83 82 77 76 74 75 69 70 82 80];

global plot_enable dcfc_efficiency_pct dcfc_per_year battery_waranty_pct year_started;
plot_enable = 1;
dcfc_efficiency_pct = 94;
dcfc_per_year = length(pct_start);
battery_waranty_pct = 65;
year_started = 1; % year data collection started; needed for battery extrapolate

idx0=35; idx_last=length(time_min);
%%%%%%%%%%%%%%%%%%%%%%%%%%%%%%%%%%%%%%%%%%%%%%%%%%%%%%%%%%%%%%%%%%%%%%%%%%%%%%%%
% DCFC changed from updating every second to every 10 seconds, and that also
% seedm to have changed power characteristics. Only look at relevant group data.
function analyze_data(idx0, idx1, ...
  pct_start, miles_start, pct_end, charge_kwh, time_min, miles_end)
  global plot_enable dcfc_efficiency_pct dcfc_per_year battery_waranty_pct year_started;
  
  pct_start   = pct_start  (idx0:idx1);
  miles_start = miles_start(idx0:idx1);
  pct_end     = pct_end    (idx0:idx1);
  charge_kwh  = charge_kwh (idx0:idx1);
  time_min    = time_min   (idx0:idx1);
  miles_end   = miles_end  (idx0:idx1);
  
  charge_pwr = charge_kwh ./ time_min * 60;
  pct_charged = pct_end - pct_start;
  miles_charged = miles_end - miles_start;
  batt_kwh = charge_kwh ./ pct_charged * dcfc_efficiency_pct;
  n=(1:length(batt_kwh))+idx0-1;

  % pct charged vs time in min; can we really get 80% in 20 minutes?
  idx_less_than_80pct = (pct_end <= 85);
  time_min_polyval = 0:30;  
  pct_charged_poly = polyfit(time_min(idx_less_than_80pct), ...
          pct_charged(idx_less_than_80pct), 1);
  pct_charged_polyval = polyval(pct_charged_poly, time_min_polyval);
  charge_kwh_poly = polyfit(time_min(idx_less_than_80pct), ...
          charge_kwh(idx_less_than_80pct), 1);
  charge_kwh_polyval = polyval(charge_kwh_poly, time_min_polyval);
  miles_charged_poly = polyfit(time_min(idx_less_than_80pct), ...
          miles_charged(idx_less_than_80pct), 1);
  miles_charged_polyval = polyval(miles_charged_poly, time_min_polyval);
  
  if plot_enable == 1        
    figure;
    plot(time_min, pct_charged, 'b.', ...
        time_min_polyval, pct_charged_polyval, 'b-', ...
        time_min, miles_charged, 'g.', ...
        time_min_polyval, miles_charged_polyval, 'g-', ... 
        time_min, charge_kwh, 'r.', ...
        time_min_polyval, charge_kwh_polyval, 'r-'); 
      grid on;
      title('raw %, miles, energy charged vs charge time, ending under 85% fit');
      xlabel('charge time (min)'); ylabel('%, miles energy charged');
      legend('% charged raw data', ...
          [num2str(pct_charged_poly(1)) ' * minutes + ' ...
            num2str(pct_charged_poly(2))],
          'miles charged raw data', ...
          [num2str(miles_charged_poly(1)) ' * minutes + ' ...
            num2str(miles_charged_poly(2))],
          'energy kwh charged raw data', ...
          [num2str(charge_kwh_poly(1)) ' * minutes + ' ...
            num2str(charge_kwh_poly(2))], ...
          'location', 'northwest');
  endif
  
  if plot_enable == 1        
    % charge power vs ending percent
    figure; plot(pct_end, charge_pwr, 'b.', pct_charged, charge_pwr, 'r.'); 
      grid on;
      title('average charge power vs %');
      xlabel('%'); ylabel('power (kW)');
      legend('% end', '% charged', 'location', 'northwest');
    
    % battery capacity over pct_charged; should not change much
    figure; plot(pct_end, batt_kwh, 'b.', pct_charged, batt_kwh, 'r.'); 
      grid on;
      title('battery capacity vs %');
      xlabel('%'); ylabel('battery capacity (kWh)');
      legend('% end', '% charged', 'location', 'northwest');
  endif
  
  % battery capacity over time and curve fitting
  % drop suspect data point, top 6 data points and bottom 1
  batt_kwh_sorted = sort(batt_kwh, 'descend');
  batt_kwh_top = batt_kwh_sorted(6);
  batt_kwh_bottom = batt_kwh_sorted(length(batt_kwh_sorted));
  idx_good_data = (batt_kwh < batt_kwh_top) & (batt_kwh > batt_kwh_bottom);
  idx_bad_data =  (batt_kwh >= batt_kwh_top) | (batt_kwh <= batt_kwh_bottom);
  
  % charged kwh vs % charged after dropping suspect data points
  charge_kwh_poly = polyfit(pct_charged(idx_good_data), ...
                            charge_kwh(idx_good_data), 1);
  pct_charged_polyval = 0:100;
  charge_kwh_polyval = polyval(charge_kwh_poly, pct_charged_polyval);
  
  if plot_enable == 1        
    figure; plot(pct_charged, charge_kwh, 'b.', ...
        pct_charged_polyval, charge_kwh_polyval, 'b-', ...
        pct_charged_polyval, charge_kwh_polyval * dcfc_efficiency_pct / 100, 'r-', ...
        pct_charged(idx_bad_data), charge_kwh(idx_bad_data), 'rx'); grid on;
      title('charge energy vs charge percent');
      xlabel('charged (%)'); ylabel('charged (kWh)');
      legend('raw data', ...
          [ 'dcfc: ' num2str(charge_kwh_poly(1)) ' * pct\_charged + ' ...
            num2str(charge_kwh_poly(2))], ...
          [ 'battery: ' num2str(charge_kwh_poly(1) * dcfc_efficiency_pct / 100) ...
            ' * pct\_charged + ' ...
            num2str(charge_kwh_poly(2) * dcfc_efficiency_pct / 100)], ...
          'discarded data', ...
          'location', 'northwest');
  endif  
  % polyfit bad-data dropped battery data, linear and exponential
  batt_poly = polyfit(n(idx_good_data), batt_kwh(idx_good_data), 1);
  batt_polyval = polyval(batt_poly, n);
  batt_poly_log = polyfit(n(idx_good_data), log(batt_kwh(idx_good_data)), 1);
  batt_polyval_log = exp(polyval(batt_poly_log, n));
    
  if plot_enable == 1
    figure; plot(n, batt_kwh, 'b.', ...
        n, batt_polyval, 'b-', n, batt_polyval_log, 'r-', ...
        n(idx_bad_data), batt_kwh(idx_bad_data),'rx' ); 
      grid on;
      axis([idx0-1 idx1+1]);
      title('battery capacity over time');
      xlabel('sample (n)'); ylabel('battery capacity (kWh)');
      legend('raw data', ...
          [num2str(batt_poly(1)) ' * n + ' num2str(batt_poly(2))], ...
          ['e\^(' num2str(batt_poly_log(1)) ' * n + ' ...
            num2str(batt_poly_log(2)) ')'], ...
          'discarded data', ...
          'location', 'northeast');
  endif
  
  %extrapolate battery capacity in years, assuming X DCFC per year
  years1 = year_started + n(idx_good_data)/dcfc_per_year;
  batt_poly = polyfit(years1, batt_kwh(idx_good_data), 1);
  batt_poly_log = polyfit(years1, log(batt_kwh(idx_good_data)), 1);
  
  years = 0:0.25:15;
  batt_polyval = polyval(batt_poly, years);
  batt_polyval_log = exp(polyval(batt_poly_log, years));
  
  % we know the initial capacity (t=0), and end of year 2 (last sample point).
  % "stretch" the years as years_eq(uivalent) so that those two points are the 
  % same as linear fit.
  years_eq = years .* (polyval(batt_poly, year_started+1) ./ batt_polyval);
  batt_polyval_eq = polyval(batt_poly, years_eq);
  batt_max = batt_poly(2) * ones(1, length(years));
  
  if plot_enable == 1
    figure; plot(years, batt_polyval, 'b-', ...
        years, batt_polyval_log, 'g-', years, batt_polyval_eq, 'r-', ...
        years, battery_waranty_pct / 100 * batt_max, 'c-', ...
        years, 50 / 100 * batt_max, 'm-' ...
      ); grid on;
      title('battery capacity extrapolated over time');
      xlabel('time (years)'); ylabel('battery capacity (kWh)');
      legend(
          [num2str(batt_poly(1)) ' * yr + ' num2str(batt_poly(2))], ...
          ['e\^(' num2str(batt_poly_log(1)) ' * yr + ' ...
            num2str(batt_poly_log(2)) ')'], ...
          'constant miles equivalent use', ...
          [num2str(battery_waranty_pct) '% of peak'], ...
          '50% of peak' ...
        );
    max_y_val = ((max(batt_polyval))/10) * 10;
    axis([0 max(years) 0 max_y_val]);
    set (gca, 'xtick', 0:max(years));
    set (gca, 'ytick', (0:max_y_val/10:max_y_val));
  endif
    
endfunction

%%%%%%%%%%%%%%%%%%%%%%%%%%%%%%%%%%%%%%%%%%%%%%%%%%%%%%%%%%%%%%%%%%%%%%%%%%%%%%%%
% check raw data

if plot_enable == 1        
  figure; plot(time_min, charge_kwh, '.'); grid on;
    title('average charge energy vs charge time'); 
    xlabel('time (min)'); ylabel('energy (kWh)');
    
  charge_pwr = charge_kwh ./ time_min * 60;
  figure; plot(charge_pwr, '.'); grid on;
    title('average charge power vs time');
    xlabel('sample (n)'); ylabel('power (kW)');

  %DCFC changed; cut the initial points that may not be valid; 2 separate analysis
  figure;
  subplot(2, 1, 1); plot(time_min(1:(idx0-1)), charge_kwh(1:(idx0-1)), '.');
    grid on;
    title(['average charge energy vs charge time, sample 1 to ' num2str(idx0-1)]); 
    xlabel('time (min)'); ylabel('energy (kWh)');
  subplot(2, 1, 2); plot(time_min(idx0:idx_last), charge_kwh(idx0:idx_last), '.');
    grid on;
    title(['average charge energy vs charge time, sample ' ...
            num2str(idx0) ' to end']); 
    xlabel('time (min)'); ylabel('energy (kWh)');
    
  % which is correct? plot efficiency to find out.
  miles = miles_end - miles_start;
  mikwh = miles ./ charge_kwh;
  mikwh_5_3 = ones(1,idx_last) * 5.3;
  mikwh_mean0 = ones(1,idx_last) * mean(mikwh(1:(idx0-1)));
  mikwh_mean1 = ones(1,idx_last) * mean(mikwh(idx0:idx_last));

  figure; plot(mikwh, 'b.', mikwh_5_3, 'g-', ...
          mikwh_5_3 * dcfc_efficiency_pct / 100, 'r-', ...
          mikwh_mean0, 'c-', mikwh_mean1, 'm-'); 
    grid on;
    title('efficiency over time');
    xlabel('sample (n)'); ylabel('efficiency (mi/kWh)');
    legend('raw data', '5.3 shown on dash', ...
        [num2str(dcfc_efficiency_pct) '% of 5.3'], ...
        ['1 to ' num2str(idx0-1) ' samples mean'], ...
        [num2str(idx0) ' to end samples mean']);
endif
        
%%%%%%%%%%%%%%%%%%%%%%%%%%%%%%%%%%%%%%%%%%%%%%%%%%%%%%%%%%%%%%%%%%%%%%%%%%%%%%%%
%analyze each data set independently

%analyze_data(1, idx0-1, ...
%  pct_start, miles_start, pct_end, charge_kwh, time_min, miles_end);
%analyze_data(idx0, idx_last, ...
%  pct_start, miles_start, pct_end, charge_kwh, time_min, miles_end);

%%%%%%%%%%%%%%%%%%%%%%%%%%%%%%%%%%%%%%%%%%%%%%%%%%%%%%%%%%%%%%%%%%%%%%%%%%%%%%%%
%fix samples 1 to 34 energy so that power looks like the rest
charge_kwh_original  = charge_kwh;
charge_kwh(1:(idx0-1)) = charge_kwh(1:(idx0-1)) * 1.137; % via trial and error
charge_pwr = charge_kwh ./ time_min * 60;

if plot_enable == 1        
  figure;
  plot(charge_pwr, '.'); grid on;
    title('average charge power vs time');
    xlabel('sample (n)'); ylabel('power (kW)');
endif

analyze_data(1, idx_last, ...
  pct_start, miles_start, pct_end, charge_kwh, time_min, miles_end);  

Friday, February 10, 2017

SparkEV is the most efficient car in world history

In previous blog post, I analyzed SparkEV acceleration performance. It was shown to have 0 to 60 MPH time of 7.2 seconds as claimed by Chevy, making it the quickest accelerating car in the world that cost under $20K.

http://sparkev.blogspot.com/2016/06/sparkev-performance-analysis.html

One would think that such quick accelerating car would have awful efficiency. After all, conventional wisdom is that quick cars like Ferrari and Porsche get about 10 miles per gallon while one of the slowest accelerating cars on the road like Mitsubishi Mirage get about 40 miles per gallon. Even among small cars, the “powerful” Chevy SparkGas with about 100 HP gets about 35 miles per gallon while 70 HP Mirage gets 5 miles more per gallon.

But upturning this conventional wisdom is SparkEV. I find that SparkEV as the quickest car in the world under $20K is also the most efficient car in history!

EPA says otherwise, buddy!

One could search the Internet and see that older model BMW i3 with 22 kWh battery was rated by EPA as 124 MPGe while SparkEV was only rated for 119 MPGe (second place, tied with Bolt).  However, the new BMW i3 with 33 kWh battery is only rated 118 MPGe, making it less efficient than SparkEV.

http://insideevs.com/longer-range-2017-bmw-i3-33-kwh-battery-94-ah-arrived-us/

But we know better than to take EPA’s word for it. After all, EPA rated 2014 SparkEV range the same as 2015 that has smaller battery while Tony Williams range test showed that both 2014 and 2015 have greater range than EPA rating when driven at 62 MPH. Since 2014 has bigger battery, Tony’s test also showed more range for 2014 than 2015. EPA’s average test speed for MPGe determination is far less than 62 MPH, so Tony’s real-world test should’ve resulted in less range than EPA rating, which it clearly was not. You can’t trust the EPA numbers when it comes to real-world efficiency.

In this blog post, I’ll explore why SparkEV is the most efficient production car in the world as well as in history.

Average efficiency over 16K miles

To start off with, my 2015 SparkEV has about 16K miles on the odometer and average efficiency in almost 2 years is 5.3 mi/kWh. At 33.7 kWh/gal of gasoline, that’s equivalent to 179 MPGe! I haven’t reset the trip meter since getting the car, and below is a screen shot of current trip meter that shows average miles per kWh.


Some forum posters claim they have over 6 mi/kWh after over 10K miles of driving. I would've said that's impossible nonsense that defy the laws of Physics if I didn't experience this for myself. SparkEV routinely get over 6 mi/kWh (202 MPGe) when driven in traffic clogged city.

Some might claim that I’m a hypermiler, which isn’t true. I drive mostly in rural roads with average speed of about 45 MPH. Still, there’s the question of my driving being too conservative. A more standard test is to set the cruise control at some speed without wind and roughly similar elevation and record the efficiency.

There are several such tests: one by Digital trends web site at 24 MPH, one recorded by Tony Williams at 62 MPH (100 kph), and another by me at 70 MPH. While 24 MPH and 62 MPH are oddball speeds, 70 MPH is something that is done regularly on the freeway, especially since roads with speed limit of 65 MPH have people driving at 70 MPH or more.

24 MPH efficiency

24 MPH resulted in 7.2 mi/kWh with 2014 SparkEV. 7.2 mi/kWh is equivalent to 243 MPGe! Unfortunately, there aren’t test done at this speed with other cars to compare this number.

http://www.digitaltrends.com/cars/spark-ev-world-record/

62 MPH (100 kph) efficiency

Tony Williams performed range tests for various EV at 62 MPH (100 kph). His test results can be found at the following link, and below that is the summary of results sorted in order of efficiency. As you can see, SparkEV clearly dominates in terms of efficiency in the real world driving at 62 MPH.

http://www.mybmwi3.com/forum/viewtopic.php?t=2718

pre 2017 Car @ 62 MPHmi/kWhMPGe
SparkEV5168.5
BMW i34.7158.4
BMW i3 Rex4.6155.0
VW eGolf4.1138.2
Nissan Leaf4134.8
Kia Soul EV4134.8
Rav4EV3.4114.6

But do I trust some third party test result? Considering Tony Williams runs the best EV after market product company in the world, I have high degree of confidence that he ran the tests properly.

Public service announcement

As a side note for those with Rav4EV or Tesla Roadster who wish to use DCFC, you can contact Tony’s company for installing Jdemo which allows you to use Chademo DCFC. If you have other EV without DCFC, watch for his company to see if they’ll announce DCFC product for you. Your “toy car without DCFC” that could only muster about 30 miles from home could drive literally thousand miles in a day with DCFC, just like real cars.

http://www.quickchargepower.com

And no, I don’t get commission from Tony. I like endorsing great products, just like how I endorsed ev-vin’s lease blog. If you’re interested in leasing an EV, check out ev-vin’s blog.

http://ev-vin.blogspot.com

70 MPH efficiency

I drove at 70 MPH, and found the efficiency to be 4.4 mi/kWh (148 MPGe). The test conditions were:

1. Charged using DCFC to 80%. It showed 73 miles remaining. Elevation at starting DCFC was 452 feet. There were two dogs and about 50 lbs of gear in the car plus the driver for a total of about 400 lb additional weight.

2. After charging to 80%, drove about 1 mile to freeway at about 30 MPH average speed (couple of traffic lights, all green).

3. Set the cruise control at 70 MPH in freeway. There wasn’t much traffic, which allowed this speed all the way, although there were few instances that I had to accelerate beyond 70 MPH for short time to pass slow semi-trucks.

4. After driving about 52 miles in freeway, I pull off the freeway.

5. Drove about 1 mile at average speed of about 40 MPH to DCFC. Elevation at ending DCFC was 698 feet, about 250 ft elevation gain.

6. Upon arrival at DCFC, car reported 8 miles remaining, and DCFC reported 10% battery remaining. Most importantly, it reported 4.4 mi/kWh for 54.05 miles trip.

Yes folks. SparkEV driven for 70% of its battery at 70 MPH AND going up 250 ft in elevation resulted in 4.4 mi/kWh (148 MPGe). Sure, it had about 2 miles of lower speed from/to DCFC, but that’s more than compensated with elevation gain and sporadic speed-up to pass slow trucks.

But you might be wondering if that’s any good. After all, Bolt is rated the same EPA highway MPGe as SparkEV, and old BMW i3 was EPA rated even higher. Unlike 62 MPH test by Tony Williams, there is no one place that ran the tests at 70 MPH in the real world for various cars. Then we google some test results from various places and come up with some numbers. Below table shows the findings and the source of the numbers.

pre 2017 Car @ 70 MPHmi/kWhMPGedata source
SparkEV4.4148.3Me!
Chevy Bolt4134.8http://insideevs.com/chevrolet-bolt-volt-real-world-efficiency-comparison-video/
BMW i33.7124.7http://www.greencarreports.com/news/1093160_2014-bmw-i3-what-a-tesla-driver-thinks-of-new-electric-bmw/page-2
Fiat 500e3.6121.3http://www.fiat500usaforum.com/archive/index.php/t-17944.html
Tesla S 70D3.429115.6https://teslamotorsclub.com/tmc/threads/epa-range-for-70d-240-miles-does-it-make-sense.45570/#post-968034
Nissan Leaf2.9298.4http://www.mynissanleaf.com/posting.php?mode=quote&f=31&p=301555&sid=e7bb77cf3f59809ed9f0ac9f27dcccbd

Clearly, SparkEV is the most efficient car in the world!

Other cars and speeds

For Renault Zoe, which is not available in US, a forum post shows 55 MPH resulting in 4 mi/kWh.

http://myrenaultzoe.com/index.php/topic/how-fast-how-far/#post-13351

SparkEV’s 4.4 mi/kWh at 70 MPH is even better than Zoe’s 4 mi/kWh at 55 MPH.

For Mitsubishi iMiev, a forum post shows 65-70 MPH result in 39 miles to low battery light and 45 miles to “turtle mode”.

https://www.edmunds.com/mitsubishi/i-miev/2012/long-term-road-test/mpg.html

iMiev has 16 kWh battery. Assuming only 14 kWh out of 16 kWh battery was used, 39 miles would be 2.79 mi/kWh. Even if you assume 45 miles, that still only 3.21 mi/kWh. (if you assume more battery used, that result in worse mi/kWh) Either way, they’re all worse than SparkEV’s 4.4 mi/kWh at constant 70 MPH.

Some caveats

How trustworthy are these number from various forum posts? I leave it up to the reader to do deeper research. But from what I found, SparkEV is clearly the most efficient car in the world. Because EV are far more efficient than cars using any other form of energy, and modern EV came on the scene just few years ago, SparkEV is the most efficient car in history!

Above discussion on efficiency was energy efficiency from battery-to-wheels point of view and assuming 33.7 kWh per gallon of gas in computing MPGe. It did not take into account charging loss. Charging efficiency using 120V is about 80%, 240V is about 85%, DCFC is about 94%. Since the 70 MPH test was done only using DCFC, we can analyze the actual energy from outlet-to-wheels rather than battery-to-wheels.

At destination DCFC in my 70 MPH test, SparkEV at 10% took 17 minutes 30 seconds and 13.07 kWh to get back to 80%. That is average power of 13.07/(17.5/60) = 44.8 kW. You might be wondering why it’s so low since SparkEV is capable of 48 kW to 80%, making it the world’s quickest charging EV.

http://sparkev.blogspot.com/2015/12/sparkev-is-quickest-charging-ev-in-world.html

Higher voltage as the battery is filled result in higher power if the current is the same (power = voltage times current). SparkEV pulls roughly the same current to 80%, so the peak power is higher while the average power would be less. In any case, close to 45 kW to 80% isn’t bad. Moving on.

54.05 miles taking 13.07 kWh is 4.14 mi/kWh.

The charging efficiency for the trip is 4.14 / 4.4 = 94%

To calculate outlet-to-wheels MPGe, one has to take 94% of battery-to-wheels figure. Even if we assume all other cars in 70 MPH test were from wall to wheels, which isn’t the case, none of them is more than 4 mi/kWh, a figure SparkEV easily beats with 4.14 mi/kWh.

Some gasbags might argue that electricity distribution is only 90% efficient and generation is only 30% efficient. While technically true in some rare instances (ie, peaker gas turbine generators), gas cars only consider efficiency from what’s in the gas tank, not what energy was used to explore, drill, ship, refine, military to invade / protect countries with oil etc. Rather than analyzing all the complex scenarios, we simply analyze what comes out from the energy stored in the car (battery to wheels).

What will beat SparkEV in efficiency?

The question that comes to mind is when will there be a car that is more efficient than SparkEV? Unfortunately, it doesn’t seem likely that will happen any time soon.

First is the question of weight. SparkEV is only 2866 lb while Leaf, Bolt, etc. are close to 3500 lb. Even the BMW i3 that uses carbon fiber to reduce the weight now has larger battery and weighs similar to SparkEV while Tesla S weighs close to 4000 lb. From rolling resistance point of view, SparkEV with small eco-tires will probably remain the most efficient EV in the world.

Second is the question of aerodynamics. While SparkEV has pretty awful drag coefficient at 0.324, it has very small frontal area. Combined, they contribute to small overall aerodynamic drag. While I haven’t investigated this further, the test result at 70 MPH shows that SparkEV performs quite well at highway speeds.

Third is the question of drive train efficiency. SparkEV is unique among EV in the gear ratio. All the other EV hover around 9 to 1 ratio (9 motor turns for 1 wheel turn). Even the Chevy Bolt hover around 7 to 1 ratio. SparkEV by comparison is about 3.17 to 1 ratio (2015+ has 3.71 to 1 ratio). That means the motor is turning less than half the speed of other EV for given road speed. While the motor efficiency is a complicated subject, slower turning tend to be more efficient when all other factors being equal since moving parts don’t have to drag around as much “fluid” (aka, air, lubricants, bearing friction).

A potential candidate that could beat SparkEV is Tesla model 3. Tesla 3 is supposed to have drag coefficient of about 0.21, but it’s also larger frontal area as well as heavier. It also has Tesla drive train that is much more powerful, which may not be as efficient as less powerful SparkEV drive train. Judging from Bolt that is more efficient than much less powerful Leaf, it seems GM engineers make the most efficient drive train even with more power. It is unlikely Tesla 3 will beat SparkEV in efficiency.

Another candidate is Hyundai Ioniq electric version (not the hybrid/plug-in hybrid). Supposedly, that has the best EPA MPGe rating among any car at 136 MPGe and much less powerful motor than SparkEV. But I discussed EPA’s problem earlier in this blog post. Until someone performs a real world test when (if?) the car becomes available, we won’t know if it’ll be more efficient than SparkEV. I suspect SparkEV will be more efficient, just because I am thoroughly impressed with Chevy engineering.

So for the foreseeable future (until SparkEV 2.0?), SparkEV will reign supreme as the most efficient car in history.

Profile of history’s most efficient car

From the test results, it seems the 2015 SparkEV has the same efficiency curve of 2014 that I deduced in earlier blog post.

http://sparkev.blogspot.com/2016/03/range-polynomial.html

Below may be what the miles per kWh (or MPGe) profile of history’s most efficient car looks like. I challenge the world to beat that.


Edit: 2017-06-28

Normally, I don’t pay attention to car’s efficiency. But going for a long drive (125 miles each way) and traffic slower than the speed limit, I got bored and started doing mi/kWh math in my head.  The car shows MPH and kW of power being used, it’s simple matter of division to figure out mi/kWh (I think this is called mental masturbation, but I digress). I was mostly getting over 6 mi/kWh and often 8 or 9 mi/kWh! I was often under the speed limit but still about 45 MPH on average, not crawling at 20 MPH.

When I got to the DCFC station about 80 miles away after about 1 hour 45 minutes of driving (1.75 hours), the car reported 6.4 mi/kWh (216 MPGe battery to wheels)! Average speed was 79/1.75 = 45 MPH. The elevation change was about 100 ft down from the starting point, but that has little effect.  Basically, if one’s in light traffic, achieving such phenomenal efficiency with SparkEV can be expected. Below is the screen shot.


The energy used in this drive was 79/6.4 = 12.34 kWh.

Then on the way back, I was curious if I can achieve the same efficiency. Unfortunately, the starting DCFC was not the same as the ending DCFC location from previous drive. In addition, the traffic was moving quite well. There were some sections of stop-and-go, and other sections where the speed was over 65 MPH, but I generally kept the cruise control set to 60 MPH. I drove 65 miles taking 1 hour 15 minutes, average speed of 52 MPH. The efficiency showed 5.4 mi/kWh (182 MPGe battery to wheels)!


The energy used in this drive was 65/5.4 = 12.04 kWh

Then the total distance for recorded section of the trip was 79+65=144 miles taking 12.34+12.04=24.38 kWh. That results in average efficiency of 5.9 mi/kWh (199 MPGe battery to wheels)!

At $0.20/kWh in San Diego electric prices, 24.4 kWh is $4.88. Gas prices are about $2.75/gal, so the cost to drive 144 miles is about 1.77 gallons of gas, or 81 miles per gallon equivalent in terms of money out of pocket (MPGe$).

That’s the real-deal: SparkEV costs less to drive than any gas car, probably less than any EV, while being the quickest car in the world that cost under $20K when new. Now THAT is an engineering marvel.

Thursday, June 30, 2016

SparkEV performance analysis

You get excited about a car's performance, and the most bold statement a car can make is acceleration, especially 0 to 60 MPH time. Indeed, we get excited about Tesla P90DL time of 2.9 seconds and even Veryon's 2.4 seconds, yet we hardly notice cars like Mitsubishi Mirage for getting 44 MPG as a gas engine car (not hybrid) with 0-60 MPH time close to 14 seconds.

That's what makes SparkEV so exciting: it is the quickest car under $20K in 0-60 MPH at 7.2 seconds while achieving 119 MPGe (EPA) or equivalent to a gas car that gets over 64 MPGe$ when gas is $2.5/gal and electricity at $0.17/kWh (efficiency at 4.4 mi/kWh wall to battery). There is no car that achieves this level of performance and efficiency for such low price.

But does SparkEV really get 0-60 MPH time of 7.2 seconds? In my informal testing, time is always less than 7 seconds, though I'm probably biased. Some claim that the time is exaggerated, and the actual time is closer to 8 seconds, but it's hard to know if they used correct conditions. To test the peak performance of any EV, the battery must be new, fully charged and cool, tires warm enough to hold traction, and many other factors. It might seem silly to talk about traction on 7.2 sec car, but if you drive SparkEV, you know that the traction control regularly kicks in when you stomp on the accelerator, especially on even slightly bumpy road. There is also the question of driver's reaction time as well as roll out uncertainty.

In this blog post, I'll do what I did with "can stock Corvette beat Tesla P90DL in 0-60 MPH" and "range polynomial" blog posts : make a model of car's acceleration from power/torque curves. Then the acceleration curve can be applied without regard to such things as driver reaction time. As before, one should heed this giant caveat.

THESE ARE MADE UP NUMBERS, AND THEY SHOULD NOT BE TRUSTED!

I will give explanations on how these plots are obtained as well as the source code. One is free to examine them and decide how valid these plots may be. Since the numbers come out roughly what's found through various other experiments, these are probably close to reality.

Experimental data

There are many experimental data on 2014 SparkEV, but none available for 2015/2016 other than Chevy's web site. While all years of SparkEV have the same power and rear wheel torque, 2014 had 21 kWh of A123 battery and it's heavier by about 100 lb compared to later years. As such, 2015/2016 would have better performance characteristics. Because we are making a model of performance, we have to start with 2014 and check/tweak our model until it matches the experimental data. Once that's done, same process can be applied to later years.

We have the following experimental data for 2014 SparkEV.

Chevy web site (no longer available)
0-60 MPH: 7.5 seconds

http://www.motortrend.com/news/2014-chevrolet-spark-ev-2lt-first-test
0-60 MPH: 7.5 seconds
1/4 mile: 16 sec at 87.6 MPH.

http://insideevs.com/plug-vehicle-cross-section-acceleration-30-mph-60-mph-ev-mode
0-30 MPH: 3.2 seconds (car and driver)
0-60 MPH: 7.9 seconds (car and driver)

http://mychevysparkev.com/forum/viewtopic.php?f=9&t=3563
0-60 MPH: 7.5 (best run)
1/4 mile: 15.8 seconds @ 86.12 mph

http://insideevs.com/whats-the-difference-0-30-mph-chevrolet-spark-ev-vs-nissan-leaf-videos
0-30 MPH: 3.1 sec
0-60 MPH: 8 sec

In summary, following can be expected.
0-30 MPH: bit over 3 seconds
0-60 MPH: bit over 7.5 seconds
1/4 mile: under 16 seconds at about 86 MPH

2014 SparkEV

Since I don't know the test conditions, I plot several scenarios:

1. 2014 with drag and 150 lb driver
2. 2014 with drag but no driver
3. 2014 with drag and 75 lb driver (dog driving?)
4. 2014 without drag and 150 lb driver


speed (mph)2014 time (sec)2014 gforce2014 no driver time (sec)2014 no driver gforce2014 75lb driver time (sec)2014 75lb driver gforce2014 no drag time (sec)2014 no drag gforce
00.000.390.000.410.000.400.000.39
50.560.410.530.430.550.420.560.41
101.120.411.060.431.090.421.120.41
151.680.411.590.431.630.421.670.41
202.240.412.130.432.180.422.230.41
252.800.402.660.432.730.422.790.41
303.360.403.200.433.280.413.340.41
353.930.403.740.423.830.413.900.40
404.520.384.300.404.410.394.480.39
455.150.354.900.375.020.365.080.36
505.860.305.580.315.720.315.760.32
556.700.266.370.276.540.266.540.28
607.670.227.290.237.480.237.420.25
658.790.198.360.208.570.208.400.22
7010.080.179.580.189.830.179.490.20
7511.580.1411.000.1511.290.1510.680.18
8013.300.1312.640.1312.970.1311.980.17
8515.300.1114.530.1114.910.1113.370.16
9018.090.0617.180.0717.640.0715.010.12

The times range from 7.29 seconds without driver (#2) to 7.67 seconds with 150 lb driver (#1). Assuming 75 lb driver is 7.48 seconds, closer to Chevy's claim. But I think it's against the law in most places to have your dog drive the car!

Kidding aside, the model is roughly in line with experimental data, though realistic case of driver + drag is about 0.17 seconds slower. Indeed, Mark from insideevs measured 3.1 seconds to 30 MPH using SparkEV with 1.5 year old and 16K miles worn battery, and the model shows 0.26 seconds slower at 3.36 seconds to 30 MPH. As you read forward, keep in mind that actual could be 0.17 to 0.26 seconds quicker than the graphs / tables shown in this blog post.

Note the g-force that's slightly above 0.4g until about 35 MPH and the gradual decrease. While this is pitiful compared to motorcycles and Tesla P90DL, contrast that to Nissan Leaf that pull maximum g only up to about 25 MPH then takes 7 seconds to accelerate from 30 MPH to 60 MPH, and you can see why SparkEV is such an acceleration beast.

I think this validates the model methodology as "close enough". Let's move on to 2015.

2015 SparkEV

2015 is about 100 lb lighter than 2014 while having the same horsepower rating. Motor torque is less, but that is compensated with lower gearing to have the same torque at the wheels, and one would expect quicker times. Since one would typically carry "stuff" and make it heavier, I plot from 0 lb to 700 lb added weights in 100 lb increments (always assume 150 lb for driver as a given). 700 lb extra (which is 850 lb including the driver) is roughly the gross vehicle weight rating (GVWR) of the car, the maximum rated weight.


speed (mph)3016lb time (sec)3016lb gforce3116lb time (sec)3116lb gforce3216lb time (sec)3216lb gforce3316lb time (sec)3316lb gforce3416lb time (sec)3416lb gforce3516lb time (sec)3516lb gforce3616lb time (sec)3616lb gforce3716lb time (sec)3716lb gforce
00.000.400.000.390.000.380.000.370.000.360.000.350.000.340.000.33
50.540.430.560.410.570.400.590.390.610.380.630.360.650.350.670.34
101.070.431.110.411.150.401.180.391.220.371.260.361.290.351.330.34
151.610.421.660.411.720.401.770.391.830.371.880.361.940.351.990.34
202.150.422.220.412.290.402.360.382.440.372.510.362.580.352.660.34
252.680.422.780.412.870.392.960.383.050.373.140.363.230.353.330.34
303.230.423.330.413.440.393.550.383.660.373.770.363.890.354.000.34
353.770.413.900.404.030.394.160.374.290.364.420.354.540.344.670.33
404.340.404.490.384.630.374.780.364.930.355.080.345.230.335.380.32
454.940.365.110.355.280.345.450.335.620.325.790.315.950.306.120.29
505.630.315.820.306.010.296.200.286.400.276.590.276.780.266.980.25
556.430.276.650.266.870.257.090.247.310.247.530.237.750.227.970.22
607.360.237.610.227.860.228.120.218.370.208.620.208.880.199.130.19
658.430.208.720.199.010.199.300.189.590.189.880.1710.170.1710.460.16
709.670.1710.000.1710.340.1610.670.1611.000.1511.340.1511.670.1412.010.14
7511.110.1511.490.1511.870.1412.260.1412.640.1313.030.1313.410.1213.800.12
8012.760.1313.200.1313.640.1214.090.1214.530.1114.980.1115.430.1115.870.10
8514.670.1115.180.1115.690.1016.200.1016.720.1017.240.0917.750.0918.270.09
9017.340.0717.950.0618.570.0619.180.0619.800.0620.420.0621.040.0521.660.05

Chevy advertises 7.2 seconds in 0-60 MPH, but no one seem to have actual drag strip data for 2015, so we don't have any basis for comparison other than Chevy's claim. The data shows that 0 lb added (but with 150 lb rider) is 7.36 seconds. Going by 0.17 second discrepancy, I suspect it'd be closer to 7.2 seconds in actual test. Then the range of acceleration through all possible additional weight is between 7.2 seconds and 9.2 seconds.

An interesting observation here is that SparkEV fully loaded with 700 lb (850 lb with driver) at 9.2 seconds would be quicker than Leaf and eGolf without any addtional load to 60 MPH (both around 10 seconds). In fact, fully loaded SparkEV is probably quicker than even unladen Toyota Mirai fuel cell car that cost $60K. That's very impressive for a car that costs $16K in CA ($18K outside of CA).

Next, the question is, what happens when you start to shed weight? There was a guy who removed body parts from Nissan Leaf to make it lighter by about 1000 lb. End result was weight to power ratio of about SparkEV.


Then let's see what happens when SparkEV starts shedding weight. Certainly, things like passenger seats and rear hatch / doors would be hundreds of pounds. I plot from 0 lb to 1000 lb removed in 100 lb increments.


speed (mph)2016lb time (sec)2016lb gforce2116lb time (sec)2116lb gforce2216lb time (sec)2216lb gforce2316lb time (sec)2316lb gforce2416lb time (sec)2416lb gforce2516lb time (sec)2516lb gforce2616lb time (sec)2616lb gforce2716lb time (sec)2716lb gforce2816lb time (sec)2816lb gforce2916lb time (sec)2916lb gforce
00.000.610.000.580.000.550.000.530.000.510.000.490.000.470.000.450.000.430.000.42
50.360.640.380.610.390.580.410.560.430.540.450.510.470.490.480.470.500.460.520.44
100.710.640.750.610.780.580.820.560.860.530.890.510.930.490.960.471.000.461.040.44
151.070.641.120.611.170.581.230.561.280.531.340.511.390.491.450.471.500.461.550.44
201.420.641.490.611.570.581.640.551.710.531.780.511.860.491.930.472.000.452.070.44
251.780.641.870.611.960.582.050.552.140.532.230.512.320.492.410.472.500.452.590.44
302.140.642.250.612.350.582.460.552.570.532.680.512.790.492.900.473.010.453.120.44
352.500.622.630.592.750.562.880.543.010.523.130.503.260.483.390.463.520.443.640.43
402.880.603.020.573.170.543.310.523.460.503.610.483.750.463.900.444.040.424.190.41
453.280.553.440.523.610.503.770.483.940.464.110.444.270.424.440.414.610.394.770.38
503.730.473.920.454.110.434.300.414.490.394.680.384.870.365.060.355.250.335.440.32
554.260.414.480.394.690.374.910.355.130.345.340.325.560.315.780.306.000.296.210.28
604.880.355.120.345.370.325.620.315.860.296.110.286.360.276.610.266.860.257.110.24
655.580.315.860.296.150.286.430.276.710.257.000.247.290.237.570.227.860.228.150.21
706.390.276.720.257.040.247.370.237.700.228.020.218.350.208.680.199.010.199.340.18
757.330.237.710.228.080.218.450.208.830.199.210.189.580.179.960.1710.340.1610.720.16
808.410.208.840.199.270.189.700.1710.140.1710.570.1611.010.1511.440.1511.880.1412.320.14
859.650.1710.150.1610.640.1611.140.1511.640.1412.140.1412.640.1313.150.1213.650.1214.160.12
9011.370.1111.960.1012.550.1013.140.0913.730.0914.330.0814.930.0815.530.0816.130.0716.730.07

With 1000 lb lighter, SparkEV would do 0-60 MPH in under 5 seconds, quicker than Tesla S70! But 1000 lb lighter is not realistic since that probably wouldn't be street legal. More realistic would be 200 lb lighter at most (ie. train your dog to drive!). That would result in 6.86 seconds. Chevy stated that Bolt will be under 7 seconds, so could SparkEV on mild diet be quicker than Bolt? At least for 0-30 MPH of 3 seconds and taking 0.17/0.26 second discrepancy into account, SparkEV would be quicker than Bolt's 2.9 seconds. We'll explore Bolt later in this post.

Climbing acceleration

What happens when accelerating on hills? Obviously, it will be slower, but how much slower will it be? I plot 2015 SparkEV with 150 lb rider over various percent grades of hills from 0% (flat road) to 20%.


2015 SparkEV acceleration over speed (mph)0% grade time (sec)0% grade gforce1% grade time (sec)1% grade gforce2% grade time (sec)2% grade gforce3% grade time (sec)3% grade gforce5% grade time (sec)5% grade gforce8% grade time (sec)8% grade gforce13% grade time (sec)13% grade gforce21% grade time (sec)21% grade gforce
00.000.400.000.390.000.380.000.370.000.350.000.330.000.280.000.20
50.540.430.550.420.560.410.580.400.610.380.660.350.770.301.050.22
101.070.431.100.421.130.411.150.401.220.381.320.351.540.302.080.22
151.610.421.650.411.690.401.730.391.820.371.980.352.310.303.110.22
202.150.422.200.412.250.402.310.392.430.372.640.343.080.294.160.22
252.680.422.750.412.820.402.890.393.040.373.310.343.860.295.200.22
303.230.423.300.413.380.403.470.393.660.373.970.344.630.296.260.22
353.770.413.860.403.960.394.060.384.280.364.650.335.430.287.340.21
404.340.404.440.394.560.384.670.374.920.355.360.326.260.278.500.19
454.940.365.060.355.190.345.330.335.620.316.120.287.180.249.820.16
505.630.315.770.305.920.296.080.286.430.267.030.238.300.1811.640.11
556.430.276.610.266.790.256.980.247.400.228.150.199.780.1414.610.06
607.360.237.570.227.800.218.040.208.570.189.520.1511.750.1020.710.03
658.430.208.700.198.980.189.290.179.970.1511.240.1214.490.07719.160.00
709.670.1710.010.1610.370.1510.770.1411.680.1213.440.0918.700.051000.000.00
7511.110.1511.540.1412.010.1312.540.1213.770.1016.320.0726.600.021000.000.00
8012.760.1313.320.1213.950.1114.650.1016.370.0820.260.0568.550.001000.000.00
8514.670.1115.410.1016.240.0917.210.0819.660.0626.120.031000.000.001000.000.00
9017.340.0718.450.0619.780.0521.450.0427.180.021000.000.001000.000.001000.000.00

Few interesting observations can be made.

1. Leaf and eGolf have 0-60 MPH time of about 10 seconds. That's like SparkEV accelerating on 8% grade. 8% grade is steeper than most roads, like "grape vine" (aka, Tejon pass) in SoCal.

2. 0-60 MPH time for iMiev is about 13 seconds and tiny 2 seater like SmartED has 11.5 seconds. That's like SparkEV accelerating on 13% to 14% grade. That is steeper than many driveways.

3. Chevy's disgraceful Iron Duke Camaro supposedly did 0-60 MPH in 20 seconds. That's about SparkEV on 20% grade. 20% grade is incredibly steep when you see it in person, about 1000 ft rise for every mile driven, almost like airplane take off.

One should keep in mind that these are only 0-60 MPH times. Those cars may be tuned for lower speed acceleration, and could be quicker than SparkEV on hill at different speeds (ie, Leaf to 30 MPH). Still, SparkEV accelerating up a hill could be kicking butt of many cars on flat road.

Climbing ability

In previous blog post "SparkEV range polynomial climbing hill", I explored SparkEV's climbing ability.

http://sparkev.blogspot.com/2016/03/range-polynomial-climbing-hill.html

While maximum climbing was left as homework for the reader, it's not possible to know the maximum without knowing the torque at the wheels, which this blog post is based on. Below plot shows maximum climbing ability over various weights. Again, lowest weight includes 150 lb driver on 2015 SparkEV and heaviest is about GVWR case.


speed (mph)3016lb climb (%)3116lb climb (%)3216lb climb (%)3316lb climb (%)3416lb climb (%)3516lb climb (%)3616lb climb (%)3716lb climb (%)
025.0025.0025.0025.0025.0025.0025.0025.00
547.1745.3043.5741.9940.5139.1537.8736.68
1047.0445.1843.4641.8840.4139.0537.7836.59
1546.9245.0643.3541.7740.3138.9537.6836.50
2046.7544.8943.1941.6240.1738.8137.5536.37
2546.5244.6842.9941.4339.9838.6437.3836.21
3046.5144.6742.9841.4239.9738.6337.3836.20
3545.1743.4041.7740.2638.8737.5736.3635.22
4043.0641.3939.8638.4437.1235.8934.7433.67
4539.0837.6036.2434.9733.8032.7031.6730.70
5032.8431.6430.5329.4928.5227.6226.7725.97
5527.8726.8725.9525.0824.2723.5122.8022.12
6023.9123.0622.2821.5420.8520.2019.5919.02
6520.5519.8319.1618.5317.9417.3816.8616.36
7017.6917.0716.4915.9515.4414.9614.5114.08
7515.2114.6814.1813.7113.2712.8612.4712.10
8013.2312.7612.3311.9211.5411.1810.8410.51
8511.2110.8110.4410.099.779.469.178.89
906.766.516.276.055.845.655.465.29

Chevy claims maximum grade at start is only about 25%. But if we go by the torque available at the wheels, it's closer to 45%! Why the discrepancy? Maybe the computer limits the torque at low speed? Regardless, I just set it to 25% at 0 MPH in the analysis.

Note that climbing ability is less than 7% grade at 90 MPH, the maximum speed of the car limited by electronics. But even if it's not limited by electronics, maximum speed may not be much more. Torque graph drops almost linearly while the force to overcome drag would increase proportional to the square of speed (power is cube of speed). I suspect SparkEV won't go much faster than 95 MPH, if that, even without electronic speed limit.

Theoretical top speed

Often the forum discussion turns to top speed of SparkEV. It's electronically limited to 90 MPH, but if there is no such restriction, what would be the top speed? Simply going by gears, and assuming the motor can spin to 10,000 RPM like other EV motors, it yields top speed close to 200 MPH! Obviously, that won't happen due to drag forces. Since we have the driving force, we can extend (ie, make up numbers, my favorite activity) to see at what speed the driving force would not be enough to overcome the drag force.


What I do is to take the last few seemingly linear samples of torque data (blue plot) and interpolate a straight line from there (green plot). Then I plot the drag data (red plot) and see where they intersect. That occurs at about 96 MPH. But even if there's no drag, the motor would top out at about 103 MPH. Were they shooting for 105 MPH to match it to 105 kW the motor is capable of? Maybe this is a little Easter egg for us! Or not; remember, these are all made up numbers.

Bolt guess

From Chevy's web site, Bolt is expected to be 2.9 seconds for 0-30 MPH. Chevy claims under 7 seconds for 0-60 MPH, but they don't say how much less. Something we can guess is Bolt's performance if it has torque profile of SparkEV. We simply scale SparkEV's torque curve to Bolt's peak torque and run the analysis. Yes, it's a total guess, but what the heck, let's see what happens.


speed (mph)bolt time (sec)bolt gforcebolt no driver time (sec)bolt no driver gforcebolt 75lb driver time (sec)bolt 75lb driver gforcebolt no drag time (sec)bolt no drag gforce
00.000.440.000.460.000.450.000.44
50.500.460.480.480.490.470.500.46
100.990.460.950.480.970.470.990.46
151.490.461.430.481.460.471.490.46
201.980.461.900.481.940.471.980.46
252.480.462.380.482.430.472.480.46
302.980.462.860.482.920.472.970.46
353.480.453.340.473.410.463.470.45
404.010.433.840.453.920.443.980.44
454.560.404.370.414.470.414.510.41
505.190.344.970.365.080.355.120.36
555.920.305.670.315.790.305.810.31
606.750.266.470.276.610.266.590.28
657.710.237.390.247.550.237.460.25
708.800.208.440.218.620.208.420.23
7510.050.179.630.189.840.189.480.21
8011.460.1610.980.1611.220.1610.630.19
8513.040.1412.500.1412.770.1411.860.18
9015.140.0914.500.0914.820.0913.310.14

Model shows 0-30 MPH time of 2.98 seconds, pretty close to Bolt's advertised time. Does this mean model's 0-60 MPH time of 6.75 seconds will be about 6.7 seconds? Maybe, maybe not. I'll be very surprised if it turns out that way. That might be the day I buy some lottery tickets.

Tangent thoughts: more gears

This blog post was re-written countless times. I started with simple analysis, which turned into dozens of plots, and into tangents like trying to find the gear ratio that will maximize 0-60 MPH time. Of course, gear change is not possible, so much of that was meaningless; they were just out of curiosity. While I won't clutter this blog post with all other tangents, I will add peak acceleration gear ratios. Who knows? Some lunatic may replace the gearbox to have quicker 0-60 MPH time, or maybe even have 3 speed massless gearbox.

We know the stock acceleration is based on top speed of 90 MPH. Then to achieve quicker acceleration, one must reduce the peak speed. Above plots' abscissa shows peak speed with gearing from 90 MPH. Essentially, 31 MPH is bit over 1/3 ratio, 62 MPH is bit over 2/3. With those gear changes, 0-30 MPH can be about 1.56 seconds, 0-60 MPH can be about 6.57 seconds.

Those are some quick times, rivaling BMW i3 and maybe even Bolt, but the top speed would be impractical. It's too bad SparkEV doesn't have 3 speed transmission. But then again, the tires squeal even with current level of acceleration, and even higher acceleration may not achieve much quicker times.

Something one can try is to see what would be the absolute maximum speed with changing the gear ratio. Recall above plot that SparkEV can barely make 103 MPH with current gearing. With gear change to move the torque curve to higher speed and sacrificing acceleration, what gear ratio would allow the highest possible speed? Homework for the reader!

Edit: 2016-10-20

While browsing youtube, I came across an excellent episode by Engineering Explained about front wheel drive cars. He uses an example of 50-50 weight distribution car with low center of mass and short wheel base to analyze the maximum acceleration of a car that has tires with coefficient of friction of 1. That seems to describe SparkEV, except for the tires' coefficient of friction.


In the episode, the conclusion is that such car would have peak acceleration of about 0.4g. And what do you know? That's about the peak acceleration of SparkEV! And as anyone who drive SparkEV could tell you, stomping on the throttle regularly kicks in the traction control. So it seems SparkEV power is tuned for what is possible for "typical" tires, and no more. Unless torque can be increased above 30 MPH, times shown in this blog post are close to the maximum one could get with SparkEV, even with different gearing.

Comparisons to other cars

Now that the model data validates experimental data to some degree, let's compare to some other cars. Insideevs has nice compilation of various EV performance.

Model0-300-6030-60Source 30-60
Tesla Model S P851.74.22.5Insideevs(1) (Tesla Motors)
Tesla Model S 85 base2.75.62.9Insideevs(2) (Consumer reports)
BMW i3 (BEV version)2.96.63.7Insideevs(1) Edmunds
V6 Camaro 323 HP2.66.64Insideevs(2) (Consumer reports)
SparkEV 20143.47.64.2model
SparkEV 20153.27.44.2model
BMW i3 Rex3.37.54.2Insideevs(2) (Consumer reports)
SparkEV 20144.7Insideevs(1)
SparkEV 20143.184.9Insideevs(3)
Honda Fit5.4Insideevs(1)
2011 Volt5.8Insideevs(1)
Fiat 500e5.9Insideevs(1)
FocusEV6.1Insideevs(1)
SmartED6.7Insideevs(1)
LEAF6.8Insideevs(1)
imiev10.6Insideevs(1)
Cmax11Insideevs(1)
2016 VoltInsideevs(4)

Insideevs(1)=http://insideevs.com/plug-vehicle-cross-section-acceleration-30-mph-60-mph-ev-mode
Insideevs(2)=comments in http://insideevs.com/plug-vehicle-cross-section-acceleration-30-mph-60-mph-ev-mode
Insideevs(3)=http://insideevs.com/whats-the-difference-0-30-mph-chevrolet-spark-ev-vs-nissan-leaf-videos
Insideevs(4)=2016 Volt stat

SparkEV is 1.4 seconds quicker to 60 MPH than the next on the list, Honda FitEV that's been discontinued for years. SparkEV even rivals BMW i3 REx that cost double and incorporate carbon fiber in its body. SparkEV even comes close to 323 HP V6 Camaro in 30-60 MPH acceleration. This is from a $16K subcompact city car. That is just WOW!

Conclusion of results

Using a model based on torque curve, I showed that 2014 experimental data roughly matches the model data. Using the model, I showed that Chevy's claim of 0-60 MPH in 7.2 second for 2015 is plausible, though bit optimistic. I explored hill climbing ability and showed that 90 MPH is close to the maximum speed of the car even without electronic speed limiting.

How they're made

Once again, we go to the sausage factory to see the meat grinder doing the work. As before, Octave is used.

Following parameters are needed:

1. Lots of free time to read sparsely commented  code
2. Freeware GNU Octave (Matlab may not work due to plotyy function)
3. Experimental data from various sources
4. Motor torque characteristics plot
5. Drag force for various speeds and weight
6. Other data such as gear ratio, tire diameter, etc.

Motor torque characteristics plot

The essense of the model is torque available at the wheels at various speeds. Combined with the tire diameter, we can find the force that's pushing the car. Such data is available in graph form.


I don't know where this plot came from, but from the looks of it, it probably came from Chevy. Are we to trust it? Well, if the model fits experimental data from other sources, it's probably good. Combined with drag data from ecomodder web site, we can make a model of the car's performance.

First thing to do is to extract numbers from torque curve graph. One can do this manually by relating pixel locations to axis. Fortunately, there are tools that allow you to do this without manually finding pixels. An excellent tool is called "WebPlotDigitizer" that works in web browser.

http://arohatgi.info/WebPlotDigitizer/app/?

Then we get these data points.


The data from the graph is not quite correct since the graph could be based on top of the "dot", middle, bottom, or anywhere in between. What we do is to correct the torque values based on known data. We know the peak torque on 2014 is 400 ft-lb at the motor with 3.17 reduction gear ratio. 2016 data is obtained from Chevy web site.

http://media.chevrolet.com/media/us/en/chevrolet/vehicles/spark-ev/2016.html

Torque is 327 ft-lb at the motor with 3.87 reduction gear ratio. Doing the math shows 1268 ft-lb for 2014 vs 1266 ft-lb for 2016 (note: above plot is N-m, not ft-lb), close enough to say that rear wheel torque are the same. Power is rated to be 105 kW (140 HP), but I recall some older publications showed 103 kW (137 HP). Let's stick to 105 kW.

Torque data from the graph is first scaled to match this peak torque number, and power at the wheels is computed. Then we "stretch" the speed corresponding to torque until this peak power is achieved. Resulting data would have 400 ft-lb peak with 3.17 gearing and 105 kW (140 HP) peak.

Below are plots with just torque scaling  (uncorrected) and power correction (corrected). Peak power occurs at 45 MPH. Assuming power out of the battery is 120 kW, it would be almost 88% efficient. Where did I get 120 kW? That's the maximum number I saw on display while hard accelerating up a hill.


A word of caution on efficiency. It is only with regard to fully stepping down on the accelerator, a worst case scenario. If the accelerator is only partially depressed, it is unknown what the efficiency would be. It may not scale linearly and most likely, it would be much higher, though the exact number is impossible to know without experiments. Still, be gentle with the accelerator if you want to conserve energy.

Something that's not clear is if the torque values are from braking horsepower (BHP) or if it's taken while accelerating. The distinction is important, because acceleration would result in angular acceleration of rotating parts (motor, gears, wheels) eating into the torque budget. Since the model seems to match the experimental data, we assume the torque figure takes into account the angular acceleration of rotating parts.

Then the question is how quick was the angular acceleration when measured? Using the most powerful engineering tool in the universe as described in the The hitchhiker's guide to the galaxy, SEP (someone else's problem)!

Dyno for everyone!

A side thought: a poor man's dyno can be made by simply measuring the angular acceleration of the tires at full throttle while the car is on jacks. One can use cheap optical sensors with strips of aluminum tape from dollar store taped to tires and microcontroller to measure the angular acceleration as the throttle is fully stomped on. Due to differential gear, it may need some tweaks, but it could be a way to measure dynamic torque / horsepower of the car very cheaply, albeit dangerously. Moment of inertia of the wheels/tires is easy to measure with standard apple (the fruit, not the computer/phone) and some strings. It would only take seconds to measure the torque / power. Ok, now back to SparkEV.

Drag force for various speeds and weight

Drag forces for various speeds are found by using ecomodder web site. The weight and aerodynamic parameters are from "reputable sources" (haha!), and drag only depend on them as opposed to power that also depend on motor efficiency. The drag values should be pretty close to actual.

Driver weight is assumed to be 150 lb. Below is the case for 2014 model year.

http://ecomodder.com/forum/tool-aero-rolling-resistance.php?Weight=3139&WeightUnits=lbs&CRR=.01&Cd=.326&FrontalArea=27&FrontalAreaUnits=ft^2&FuelWh=33557&IceEfficiency=.9&DrivetrainEfficiency=.95&ParasiticOverhead=500&rho=1.225&FromToStep=5-200-5

Below is to get drag data for 2015 model year by simply changing the weight.

http://ecomodder.com/forum/tool-aero-rolling-resistance.php?Weight=3016&WeightUnits=lbs&CRR=.01&Cd=.326&FrontalArea=27&FrontalAreaUnits=ft^2&FuelWh=33557&IceEfficiency=.9&DrivetrainEfficiency=.95&ParasiticOverhead=500&rho=1.225&FromToStep=5-200-5

Below is to get drag data for GVWR (3761 lb)

http://ecomodder.com/forum/tool-aero-rolling-resistance.php?Weight=3761&WeightUnits=lbs&CRR=.01&Cd=.326&FrontalArea=27&FrontalAreaUnits=ft^2&FuelWh=33557&IceEfficiency=.9&DrivetrainEfficiency=.95&ParasiticOverhead=500&rho=1.225&FromToStep=5-200-5

One thing to note is that Webplotdigitizer spits out 80 data points while ecomodder spits out 19 data points. To reconcile, I again use polynomial on drag data. Since drag force data is determined by running a math model at ecomodder web site, I'm basically reversing that process by using second order polynomial (recall power is third order, then force is second order). Then I plug in 80 speed parameters to the polynomial, and it will be accurate to any speed. In essence, it's interpolation with 100% accuracy at any speed! (yeah, sure).

Other data

Tire diameter for 185/55R15 tires is found from https://tiresize.com/chart as 23 inches.

All the others can be found in Chevy web site or various google searches.

Appendix

I can go through the code and explain each line, but this blog post is running way too long as is. Besides, I think the code is entirely self explanatory, no further comment needed (the famous last words before software engineer getting fired)! So without further delay, below is the m-file for you to try out in Octave.

close all; clear;

global fname; fname = 'acceleration.csv';
dlmwrite(fname, '');

% parameters from torque graph
speed_mph =[0.00 0.89 2.17 3.35 4.53 5.71 6.89 8.07 9.25 10.43 11.61 ...
            12.79 13.96 15.14 16.32 17.50 18.68 19.86 21.04 22.22 ...
            23.40 24.58 25.76 26.94 28.12 29.29 30.47 31.65 32.83 ...
            34.01 35.19 36.37 37.55 38.73 39.94 41.09 42.27 43.45 ...
            44.30 45.28 46.32 47.30 48.27 49.23 50.25 51.38 52.56 ...
            53.74 54.92 56.09 57.27 58.45 59.63 60.81 61.99 63.17 ...
            64.35 65.53 66.71 67.89 69.07 70.25 71.42 72.60 73.78 ...
            74.96 76.14 77.32 78.50 79.68 80.86 82.04 83.22 84.40 ...
            85.58 86.54 87.49 88.38 89.36 90];
torque_nm =[1630 1631 1718 1724 1717 1715 1715 1715 1715 1715 1715 ...
            1715 1715 1715 1715 1715 1715 1715 1715 1715 1715 1715 ...
            1715 1717 1722 1723 1719 1710 1701 1691 1681 1668 1654 ...
            1639 1615 1595 1565 1530 1494 1457 1418 1378 1340 1303 ...
            1265 1234 1199 1166 1134 1104 1075 1047 1021 995.4 970.5 ...
            946.5 924.3 902.4 882.3 862.9 844.6 826.8 809.8 792.9 ...
            777.3 764.2 752.6 741.9 731.3 720.1 706.7 690.4 669.3 ...
            640.0 602.8 558.9 519.9 480.4 443.2 411.2];

% SparkEV gear ratios
gear_ratio_2014 = 3.17;
gear_ratio_2015 = 3.87;

% maximum power displayed when accelerating hard on steep slope
global battery_power_kw; battery_power_kw = 120;
motor_power_kw = 105;

% stock tire diameter of 185/55R15
tire_ft = 23/12/2; 

% drag force data from ecomooder
global speed_mph_integer; speed_mph_integer = 0:5:90;

% mass is always assumed with 150 lb driver
mass_2014_lb = 2989 + 150;
mass_2015_lb = 2866 + 150;
mass_gvwr_lb = 3761;

% drag values from ecomodder web site in newtons
drag_2014_n = [142.13 142.13 149.64 162.15 179.67 202.19 229.71 ...
                       262.25 299.78 342.32 389.87 442.42 499.97 562.53 ...
                       630.09 702.66 780.23 862.81 950.4];
drag_2015_n = [136.66 136.66 144.17 156.68 174.2 196.72 224.24 ...
                       256.77 294.31 336.85 384.39 436.94 494.5 557.06 ...
                       624.62 697.19 774.76 857.34 944.92];
drag_gvwr_n = [169.8 169.8 177.31 189.82 207.34 229.86 257.38 ...
                       289.91 327.45 369.99 417.53 470.08 527.64 590.2 ...
                       657.76 730.33 807.9 890.48 978.06];

% some conversion factors
global feet_in_mile; global rpm_ftlb_to_hp; global hp_to_kw;
feet_in_mile = 5280; rpm_ftlb_to_hp = 5252; hp_to_kw = 0.7457;

nm_to_ftlb = 0.737562149;
newton_to_pound = 0.224809;

torque_ftlb = torque_nm * nm_to_ftlb;
driveforce_lb = torque_ftlb / tire_ft;

% polynomial for drag force so we can interpolate for higher speeds.
drag_2014_lb_poly = polyfit(speed_mph_integer, ...
                            drag_2014_n * newton_to_pound, 2);
drag_2015_lb_poly = polyfit(speed_mph_integer, ...
                            drag_2015_n * newton_to_pound, 2);
drag_gvwr_lb_poly = polyfit(speed_mph_integer, ...
                            drag_gvwr_n * newton_to_pound, 2);

%%%%%%%%%%%%%%%%%%%%%%%%%%%%%%%%%%%%%%%%%%%%%%%%%%%%%%%%%%%%%%%%%%%%%%%%%%%%%%%%
% Functions to write to file

global csv_head; global csv_data;
csv_head = cellstr('speed (mph)');
csv_data = speed_mph_integer';

function fwrite_text(data)
  global fname;
  fid=fopen(fname,'at');
  fprintf(fid, data);
  fclose(fid);
endfunction

function csv_data_append(header, speed_mph, data_raw)
  global speed_mph_integer; global csv_head; global csv_data;

  csv_head = [csv_head cellstr(header)];
  data = interp1(speed_mph, data_raw, speed_mph_integer)';
  csv_data = [csv_data data];
endfunction

function csv_file_write(fname)
  global speed_mph_integer; global csv_head; global csv_data;

  fid=fopen(fname,'at');
  [rows,cols]=size(csv_head);
  for i=1:rows
    fprintf(fid,'%s,',csv_head{i,1:end-1})
    fprintf(fid,'%s\n',csv_head{i,end})
  end
  fclose(fid);
  dlmwrite(fname, csv_data, '-append');

  csv_head = cellstr('speed (mph)');
  csv_data = speed_mph_integer';
endfunction

%%%%%%%%%%%%%%%%%%%%%%%%%%%%%%%%%%%%%%%%%%%%%%%%%%%%%%%%%%%%%%%%%%%%%%%%%%%%%%%%
% octave plotyy has a bug as well as not recommended for Matlab

function [ax, h1, h2] = myplotyy(x, y1, y2, alegend, alocation)
  % global EXECUTABLE
  % if EXECUTABLE==MATLAB
  %   yyaxis or some such
  % else % OCTAVE
    % Octave has problem with legend and data order with plotyy
    [ax,h1,h2]=plotyy( x, y1, x, y2 );
    legend(fliplr(alegend)', 'location', alocation);
    set(h2, {'Color'},get(h1,'Color'));
  % end
endfunction

%%%%%%%%%%%%%%%%%%%%%%%%%%%%%%%%%%%%%%%%%%%%%%%%%%%%%%%%%%%%%%%%%%%%%%%%%%%%%%%%
% find peak power and make minor adjustment to data to match spec

function [tire_power_kw,efficiency_pct] = ...
    compute_power(atitle, speed_mph, tire_ft, torque_ftlb)
  global feet_in_mile; global rpm_ftlb_to_hp; global hp_to_kw;
  global battery_power_kw;

  tire_rpm = speed_mph * feet_in_mile / 60 / (2 * pi * tire_ft);
  tire_power_kw = torque_ftlb .* tire_rpm / rpm_ftlb_to_hp * hp_to_kw;

  efficiency_pct = tire_power_kw / battery_power_kw * 100;

  csv_data_append([atitle ' tire power (kW)'], speed_mph, tire_power_kw);
  csv_data_append([atitle ' efficiency (%)'], speed_mph, efficiency_pct);
endfunction

function plot_power(legend_2, speed_mph, tire_power_kw_2, efficiency_pct_2)
  global battery_power_kw;
  figure;
  [ax,h1,h2]=myplotyy(speed_mph, tire_power_kw_2, efficiency_pct_2, ...
      legend_2, 'east');
  ylabel(ax(2), 'efficiency (%)'); ylabel(ax(1), 'power (kW)');
  axis(ax(2), [0 90 0 100]); axis(ax(1), [0 90 0 battery_power_kw]);
  set(ax(2), 'ytick', 0:10:100); set(ax(1), 'ytick', 0:12:battery_power_kw);
  grid on; xlabel('speed (mph)'); set(ax(1), 'xtick', 0:10:90);
  title('Power efficiency at peak torque');

  nn=2; %was for loop, but too messy
    peak_eff = max(efficiency_pct_2(:,nn));
    peak_eff_speed = speed_mph( efficiency_pct_2(:,nn) == peak_eff );
    peak_power = max(tire_power_kw_2(:,nn));
    hold on;
      plot(peak_eff_speed:peak_eff_speed, 0:battery_power_kw, 'r-');
    hold off;
    text(peak_eff_speed+1, peak_power+1, ...
      [num2str(round(peak_eff_speed*10)/10) ' mph, ' ...
        num2str(round(peak_eff*10)/10) '%, ' ...
        num2str(round(peak_power*10)/10) ' kW']);
endfunction

fwrite_text('SparkEV power and efficiency\n');

% we know 2014 torque at 400 ft-lb and gear ratio. adjust torque so that
% peak torque matches specified data.
correction_torque = (400*gear_ratio_2014) / max(torque_ftlb);
torque_nm = torque_nm * correction_torque;
torque_ftlb = torque_ftlb * correction_torque;
driveforce_lb = driveforce_lb * correction_torque;

% find power with new torque value; peak power may not match, so uncorrected
atitle = 'uncorrected';
[tire_power_kw,efficiency_pct] = ...
    compute_power(atitle, speed_mph, tire_ft, torque_ftlb);
tire_power_kw_2 = tire_power_kw';
efficiency_pct_2 = efficiency_pct';
legend_2 = cellstr(atitle);

% Chevy specifies peak power of 105 kW. Expand speed to achieve that.
% It should also match 60 kW at 90MPH shown in power curve.
correction_power = motor_power_kw / max(tire_power_kw);
speed_mph = speed_mph * correction_power;

atitle = 'corrected';
[tire_power_kw,efficiency_pct] = ...
    compute_power(atitle, speed_mph, tire_ft, torque_ftlb);
tire_power_kw_2 = [tire_power_kw_2 tire_power_kw'];
efficiency_pct_2 = [efficiency_pct_2 efficiency_pct'];
legend_2 = [legend_2 cellstr(atitle)];

plot_power(legend_2, speed_mph, tire_power_kw_2, efficiency_pct_2);
csv_file_write(fname);

%%%%%%%%%%%%%%%%%%%%%%%%%%%%%%%%%%%%%%%%%%%%%%%%%%%%%%%%%%%%%%%%%%%%%%%%%%%%%%%%
% Function to find drag force for different weights
% In absense of full formula to find drag, we have to figure out how to compute
%   various drag force for different weights rather than running ecomodder
%   website each time. It seems drag polynomial coefficient for lowest order
%   changes for various weights at 1% (rolling resistance). That's totally
%   expected. Therefore, it's simply replacing lowest order coefficient with
%   1% of mass to find new drag.

function drag_force_lb = find_drag(drag_lb_poly, mass_lb, speed_mph)
  % finds new drag force for any mass
  drag_poly = drag_lb_poly;
  drag_poly(3) = mass_lb * 0.01;
  drag_force_lb = polyval(drag_poly, speed_mph);
endfunction

%%%%%%%%%%%%%%%%%%%%%%%%%%%%%%%%%%%%%%%%%%%%%%%%%%%%%%%%%%%%%%%%%%%%%%%%%%%%%%%%
% Function to find acceleration times, gforce, distance traveled. Note that 
%   time for speed is different from distance traveled

function [time_sec, gforce, time_dist_sec, dist_miles] = ...
         find_time_dist(driveforce_lb, mass_lb, drag_lb, speed_mph)
  ft_per_sec_to_mph = 1.4666667;
  gravity_ft_sec_sec = 32.2;

  % find gforce and speed over time
  gforce = (driveforce_lb-drag_lb) ./ (mass_lb);
  acc_mph_per_sec = gforce * gravity_ft_sec_sec / ft_per_sec_to_mph;
  speed_delta_mph = [0 ...
        (speed_mph(2:length(speed_mph)) - speed_mph(1:length(speed_mph)-1))];
  time_delta_sec = speed_delta_mph ./ acc_mph_per_sec;
  time_sec = cumsum(time_delta_sec);

  % find distance over time
  speed_extend_mph = [speed_mph ones(1, 1000)*max(speed_mph)];
  time_delta_extend_sec = [time_delta_sec ones(1, 1000)*0.1];
  distance_delta_miles = (speed_extend_mph/3600) .* time_delta_extend_sec;
  time_dist_sec = cumsum(time_delta_extend_sec);
  dist_miles = cumsum(distance_delta_miles);
endfunction

%%%%%%%%%%%%%%%%%%%%%%%%%%%%%%%%%%%%%%%%%%%%%%%%%%%%%%%%%%%%%%%%%%%%%%%%%%%%%%%%
% function to compute and plot single car data

function plot_one_car(car_name, mass_base_lb, drag_base_lb_poly, speed_mph, ...
    driveforce_lb)
  time_sec_2=[]; gforce_2=[]; time_dist_sec_2=[]; dist_miles_2=[];
  legend_2 = [];

  for nn=1:4
    if nn==1
      atitle = car_name; mass_lb = mass_base_lb;
    elseif nn==2
      atitle = [car_name ' no driver']; mass_lb = mass_base_lb - 150;
    elseif nn==3
      atitle = [car_name ' 75lb driver']; mass_lb = mass_base_lb - 75;
    elseif nn==4
      atitle = [car_name ' no drag']; mass_lb = mass_base_lb;
      drag_base_lb_poly = zeros(1, length(drag_base_lb_poly));
    end

    drag_lb = find_drag(drag_base_lb_poly, mass_lb, speed_mph);
    [time_sec, gforce, time_dist_sec, dist_miles] = ...
        find_time_dist(driveforce_lb, mass_lb, drag_lb, speed_mph);
    csv_data_append([atitle ' time (sec)'], speed_mph, time_sec);
    csv_data_append([atitle ' gforce'], speed_mph, gforce);
    
    if (nn==1)
      legend_2 = cellstr(atitle);
    else
      legend_2 = [legend_2 cellstr(atitle)];
    end
    time_sec_2 = [time_sec_2 time_sec'];
    gforce_2 = [gforce_2 gforce'];
    time_dist_sec_2 = [time_dist_sec_2 time_dist_sec'];
    dist_miles_2 = [dist_miles_2 dist_miles'];
  end

  figure; 
  [ax,h1,h2]=myplotyy(time_sec_2, gforce_2, speed_mph', legend_2, 'east');
  xlabel('time (sec)'); set(gca, 'xtick', 0:1:10);
  ylabel(ax(2), 'speed (mph)'); ylabel (ax(1), 'g force');
  miny=.15; maxy=.5;
  axis(ax(2), [0 10 0 70]); axis(ax(1), [0 10 miny maxy]); grid on;
  set(ax(2), 'ytick', 0:10:70); set(ax(1), 'ytick', miny:(maxy-miny)/7:maxy);
  title([car_name ' acceleration speed vs time']);

  max_x = 20;
  figure; plot(time_dist_sec_2, dist_miles_2);
  xlabel('time (sec)'); ylabel('distance (miles)');
  axis([0 max_x 0 0.3]); grid on;
  set(gca, 'xtick', 0:max_x); set(gca, 'ytick', 0:0.025:0.3);
  title([car_name ' acceleration distance vs time']);
  legend(legend_2, 'location', 'east');
endfunction

%%%%%%%%%%%%%%%%%%%%%%%%%%%%%%%%%%%%%%%%%%%%%%%%%%%%%%%%%%%%%%%%%%%%%%%%%%%%%%%%
% find data for 2014

plot_one_car('2014', mass_2014_lb, drag_2014_lb_poly, speed_mph, driveforce_lb);
csv_file_write(fname);

%%%%%%%%%%%%%%%%%%%%%%%%%%%%%%%%%%%%%%%%%%%%%%%%%%%%%%%%%%%%%%%%%%%%%%%%%%%%%%%%
% run data for all mass, from -1000 lb to +700 lb based on 2015 mass

% function to plot acceleration for various weights
function plot_acc_over_weights(atitle, speed_mph, mass_min_lb, mass_max_lb, ...
    drag_base_lb_poly, driveforce_lb)
  mass_lb_2=[]; time_sec_2=[]; gforce_2=[]; time_dist_sec_2=[]; dist_miles_2=[];
  for mass_lb=[mass_min_lb:100:mass_max_lb]
    drag_lb = find_drag(drag_base_lb_poly, mass_lb, speed_mph);
    [time_sec, gforce, time_dist_sec, dist_miles] = ...
        find_time_dist(driveforce_lb, mass_lb, drag_lb, speed_mph);

    mass_lb_2 = [mass_lb_2 mass_lb];
    time_sec_2 = [time_sec_2 time_sec'];
    gforce_2 = [gforce_2 gforce'];
    time_dist_sec_2 = [time_dist_sec_2 time_dist_sec'];
    dist_miles_2 = [dist_miles_2 dist_miles'];

    csv_data_append([num2str(mass_lb) 'lb time (sec)'], speed_mph, time_sec);
    csv_data_append([num2str(mass_lb) 'lb gforce'], speed_mph, gforce);
  end

  figure; 
  [ax,h1,h2]=myplotyy(time_sec_2, gforce_2, speed_mph', ...
      cellstr(num2str(mass_lb_2'))', 'east');
  grid on; xlabel('time (sec)'); set(gca, 'xtick', 0:1:10);
  ylabel(ax(2), 'speed (mph)'); ylabel (ax(1), 'g force');

  if mass_min_lb > 3000
    axis(ax(2), [0 10 0 70]); set(ax(2), 'ytick', 0:10:70);
    miny=0.15; maxy=0.5; divy=7;
  else
    axis(ax(2), [0 10 0 90]); set(ax(2), 'ytick', 0:10:90);
    miny=.15; maxy=0.69; divy=9;
  end
  axis(ax(1), [0 10 miny maxy]);
  set(ax(1), 'ytick',miny:((maxy-miny)/divy):maxy);
  title(atitle);
endfunction

atitle = '2015 SparkEV acceleration for weight gain speed vs time';
plot_acc_over_weights(atitle, ...
    speed_mph, mass_2015_lb, mass_2015_lb+700, ...
    drag_2015_lb_poly, driveforce_lb);
fwrite_text([atitle '\n']); csv_file_write(fname);

atitle = '2015 SparkEV acceleration for weight reduction speed vs time';
plot_acc_over_weights(atitle, ...
    speed_mph, mass_2015_lb-1000, mass_2015_lb-100, ...
    drag_2015_lb_poly, driveforce_lb);
fwrite_text([atitle '\n']); csv_file_write(fname);

%%%%%%%%%%%%%%%%%%%%%%%%%%%%%%%%%%%%%%%%%%%%%%%%%%%%%%%%%%%%%%%%%%%%%%%%%%%%%%%%
% acceleration over hills

function plot_hill_acceleration(atitle, speed_mph, mass_lb, ...
    drag_base_lb_poly, driveforce_lb)
  grade_pct_2=[];
  time_sec_2=[]; gforce_2=[]; time_dist_sec_2=[]; dist_miles_2=[];
  for grade_pct=[0 1 2 3 5 8 13 21]
    hill_angle = atan(grade_pct/100);
    mass_normal = mass_lb * cos(hill_angle);

    drag_lb = find_drag(drag_base_lb_poly, mass_normal, speed_mph);
    hill_driveforce_lb = driveforce_lb - mass_lb * sin(hill_angle);
    [time_sec, gforce, time_dist_sec, dist_miles] = ...
        find_time_dist(hill_driveforce_lb, mass_lb, drag_lb, speed_mph);

    %zero out negative values due to too steep hill
    time_sec(gforce<0) = 1000; gforce(gforce<0) = 0;
    time_sec(time_sec<0) = 1000; gforce(time_sec<0) = 0;

    grade_pct_2 = [grade_pct_2 grade_pct];
    time_sec_2=[time_sec_2 time_sec'];
    gforce_2=[gforce_2 gforce'];
    time_dist_sec_2=[time_dist_sec_2 time_dist_sec'];
    dist_miles_2=[dist_miles_2 dist_miles'];

    csv_data_append([num2str(grade_pct) '% grade time (sec)'], ...
        speed_mph, time_sec);
    csv_data_append([num2str(grade_pct) '% grade gforce'], speed_mph, gforce);
  end

  figure; 
  [ax,h1,h2]=myplotyy(time_sec_2, gforce_2, speed_mph', ...
      cellstr(num2str(grade_pct_2'))', 'east');
  xlabel('time (sec)');   set(gca, 'xtick', 0:2:20); grid on;
  ylabel(ax(2), 'speed (mph)'); ylabel (ax(1), 'g force');
  axis(ax(2), [0 20 0 70]); set(ax(2), 'ytick', 0:10:70);

  miny=0; maxy=0.49; divy=7;
  axis(ax(1), [0 20 miny maxy]);
  set(ax(1), 'ytick',miny:((maxy-miny)/divy):maxy);
  title(atitle);
endfunction

atitle = '2015 SparkEV acceleration over % grades speed vs time';
plot_hill_acceleration(atitle, speed_mph, mass_2015_lb, ...
    drag_2015_lb_poly, driveforce_lb);
fwrite_text([atitle '\n']); csv_file_write(fname);

%%%%%%%%%%%%%%%%%%%%%%%%%%%%%%%%%%%%%%%%%%%%%%%%%%%%%%%%%%%%%%%%%%%%%%%%%%%%%%%%
% climbing ability for various weights

function plot_climbing(atitle, speed_mph, mass_2015_lb, drag_base_lb_poly, ...
    driveforce_lb)
  mass_lb_2=[]; climb_pct_2=[];
  for mass_delta=[0:100:700]
    mass_lb = mass_2015_lb+mass_delta;
    drag_lb = find_drag(drag_base_lb_poly, mass_lb, speed_mph);

    force_lb = driveforce_lb - drag_lb;
    climb_pct = tan(asin((force_lb)/(mass_lb))) * 100;

    %Chevy specifies max hill start as 25% at 0 MPH
    climb_pct(1)=25;

    mass_lb_2 = [mass_lb_2; mass_lb];
    climb_pct_2 = [climb_pct_2 climb_pct'];

    csv_data_append([num2str(mass_lb) 'lb climb (%)'], speed_mph, climb_pct);
  end

  figure; plot( speed_mph, climb_pct_2);
  xlabel('speed (mph)'); ylabel('grade (%)');
  axis([0 90 0 50]); grid on;
  set(gca, 'xtick', 0:5:90); set(gca, 'ytick', 0:5:50);
  title(atitle);
  legend(cellstr(num2str(mass_lb_2)), 'location', 'northeast');
endfunction

atitle = '2015 SparkEV climbing ability vs speed over weight';
plot_climbing(atitle, speed_mph, mass_2015_lb, drag_2015_lb_poly, ...
    driveforce_lb);
fwrite_text([atitle '\n']); csv_file_write(fname);

%%%%%%%%%%%%%%%%%%%%%%%%%%%%%%%%%%%%%%%%%%%%%%%%%%%%%%%%%%%%%%%%%%%%%%%%%%%%%%%%
% Bolt guess

bolt_peak_motor_torque_ftlb = 266;
bolt_gear_ratio = 7.05;
bolt_tire_radius_ft = 25.5 / 12 / 2;
bolt_mass_lb = 3580 + 150;
bolt_peak_power_kw = 150;

% find the speed at which Bolt's peak power will occur
bolt_rpm_to_mph = (2*pi*bolt_tire_radius_ft/feet_in_mile) / bolt_gear_ratio* 60;
bolt_peak_motor_power_rpm = ...
    rpm_ftlb_to_hp * bolt_peak_power_kw/hp_to_kw / bolt_peak_motor_torque_ftlb;
bolt_peak_motor_power_mph = bolt_peak_motor_power_rpm * bolt_rpm_to_mph;

% SparkEV torque to Bolt by simply scaling
bolt_torque_ftlb = bolt_peak_motor_torque_ftlb * bolt_gear_ratio * ...
                   (torque_ftlb / max(torque_ftlb));
bolt_driveforce_lb = bolt_torque_ftlb / bolt_tire_radius_ft;

plot_one_car('bolt', bolt_mass_lb, drag_2015_lb_poly, speed_mph, bolt_driveforce_lb);
csv_file_write(fname);

%%%%%%%%%%%%%%%%%%%%%%%%%%%%%%%%%%%%%%%%%%%%%%%%%%%%%%%%%%%%%%%%%%%%%%%%%%%%%%%%
% find quickest gear ratio for speeds by going through all ratios

function find_best_gear_ratio(drag_lb_poly, mass_lb, speed_mph, driveforce_lb)
  time_max_30mph=[]; time_max_60mph=[];
  peak_speeds = 31:90;
  for peak_speed=peak_speeds
    gear_ratio = peak_speed / 90;
    gear_driveforce_lb = driveforce_lb / gear_ratio;
    gear_speed_mph = speed_mph * gear_ratio;
    
    drag_lb = find_drag(drag_lb_poly, mass_lb, gear_speed_mph);
    [time_sec, gforce, time_dist_sec, dist_miles] = ...
        find_time_dist(gear_driveforce_lb, mass_lb, drag_lb, gear_speed_mph);
    
    gear_int_speed_mph = 0:fix(max(gear_speed_mph));
    gear_int_time_sec = interp1(gear_speed_mph, time_sec, gear_int_speed_mph);
    
    time_max_30mph = [time_max_30mph gear_int_time_sec(gear_int_speed_mph==30)];
    if (max(gear_int_speed_mph) < 60)
      time_max_60mph = [time_max_60mph 0];
    else
      time_max_60mph = [time_max_60mph gear_int_time_sec(gear_int_speed_mph==60)];
    end
  end

  figure;
  subplot(2, 1, 1); plot(peak_speeds, time_max_30mph, 'o-');
  xlabel('peak speed (mph)'); ylabel('time (sec)');
  axis([31 37 1.55 1.63]); grid on;
  title('best peak speed gearing for 30 MPH acceleration');
  subplot(2, 1, 2); plot( peak_speeds, time_max_60mph, 'o-');
  xlabel('peak speed (mph)'); ylabel('time (sec)');
  axis([60 66 6.56 6.64]); grid on;
  title('best peak speed gearing for 60 MPH acceleration');
endfunction

find_best_gear_ratio(drag_2015_lb_poly, mass_2015_lb, speed_mph, driveforce_lb)

%%%%%%%%%%%%%%%%%%%%%%%%%%%%%%%%%%%%%%%%%%%%%%%%%%%%%%%%%%%%%%%%%%%%%%%%%%%%%%%%
% find theoretical maximum speed with gear change

function plot_maxspeed_with_gear_chage(speed_mph, driveforce_lb, drag_poly, ...
    mass_lb)
  ext_min_speed = 88; ext_max_speed=105; ext_plot_min_speed = 75;
  ext_speed_mph = ext_min_speed:ext_max_speed;
  ext_driveforce_poly = polyfit(speed_mph(speed_mph > ext_min_speed), ...
      driveforce_lb(speed_mph > ext_min_speed), 1);
  ext_driveforce_lb = polyval(ext_driveforce_poly, ext_speed_mph);

  ext_drag_speed = ext_plot_min_speed:ext_max_speed;
  ext_drag_lb = find_drag(drag_poly, mass_lb, ext_drag_speed);

  figure;
  plot(speed_mph(speed_mph > ext_plot_min_speed), 
      driveforce_lb(speed_mph > ext_plot_min_speed), 'bo-');
  hold on;
    plot(ext_speed_mph, ext_driveforce_lb, 'go-');
    plot(ext_drag_speed, ext_drag_lb, 'ro-');
  hold off;

  xlabel('speed (mph)'); ylabel('force (lb)');
  axis([75 105 0 600]); grid on;
  title('SparkEV theoretical peak speed');
  legend('drive force', 'extended drive force', 'drag force');
endfunction

plot_maxspeed_with_gear_chage(speed_mph, driveforce_lb, drag_2015_lb_poly, ...
    mass_2015_lb);